S&P 500 (SPY)
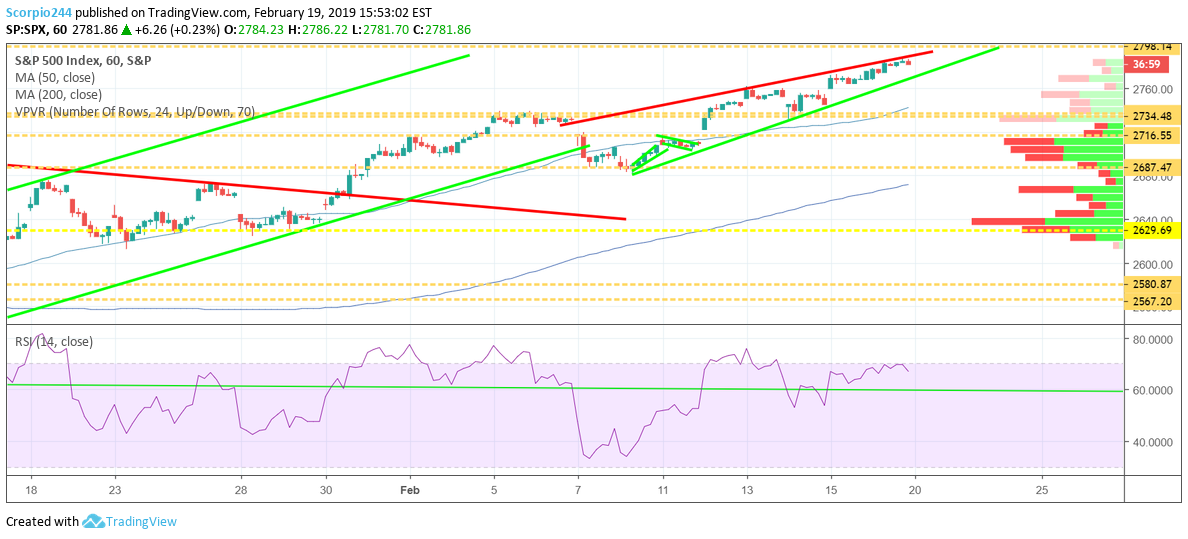
Stocks continued to rise on Tuesday with the S&P 500 increasing 15 basis points to close around 2,780. We are now about 15 points from our zone of resistance at 2,795. I’m getting the sense that the rally may pause tomorrow, February 20 with a steep pullback to around 2,750 over the next day or two. There appears to be short-term rising wedge forming in the S&P 500, and then there is a pretty sizeable gap at that level. It would at the very least suggest a drop to 2,760.
I don’t think it changes anything longer-term. I don’t think a one or two-day sell-off is the end of a rebound in global growth or stocks. It will be a one or two sell-off, nothing more and nothing less. I’m sure all the headline will be something bearish like: “The Next Big Wave Lower Is Upon Us”, with this big scary bear, but I don’t believe that to the case.
I could be wrong, and the S&P 500 can continue to rally. I see a pullback in stock prices at the moment.
NASDAQ
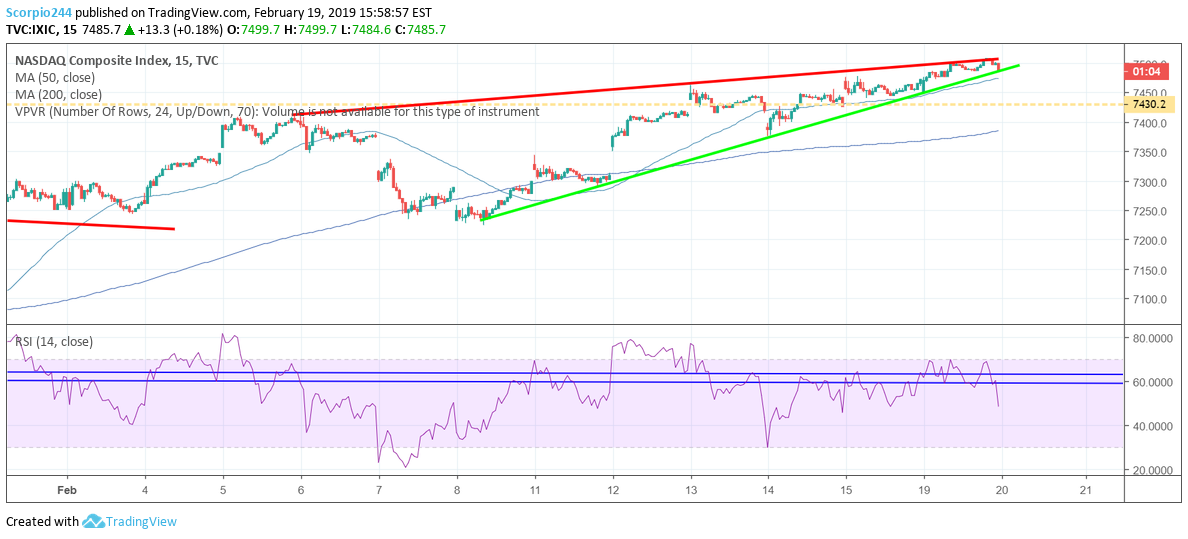
We can see a similar pattern has formed in the NASDAQ as well.
Boeing (BA)
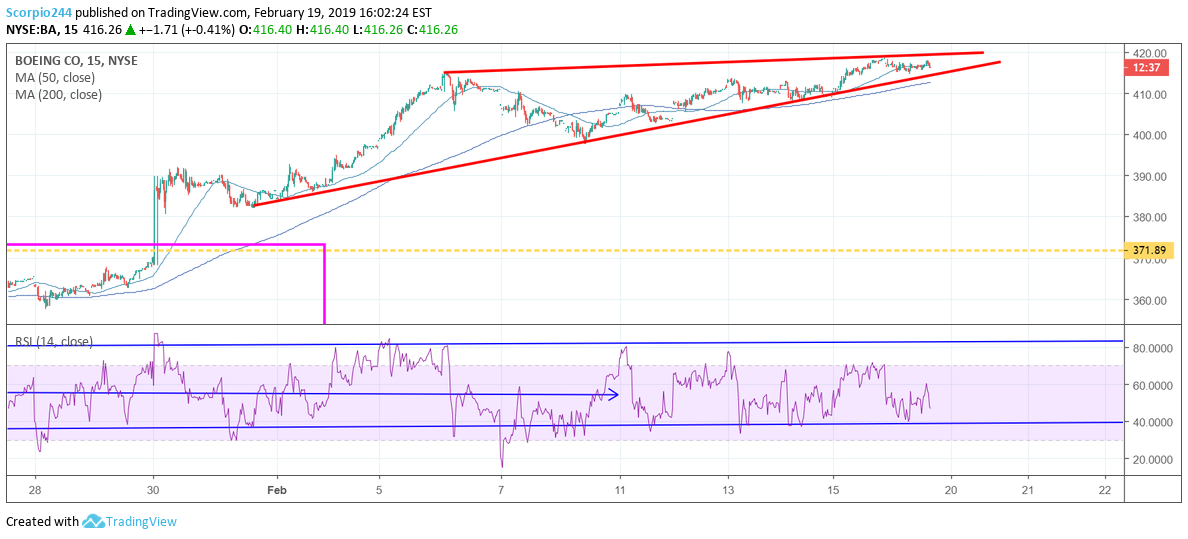
Boeing Co (NYSE:BA) is one example of a stock that has a similar pattern forming in the chart. Maybe we will get some “trade news” tomorrow that reads something like: U.S. and China still light years apart.
Industrials (XLI)
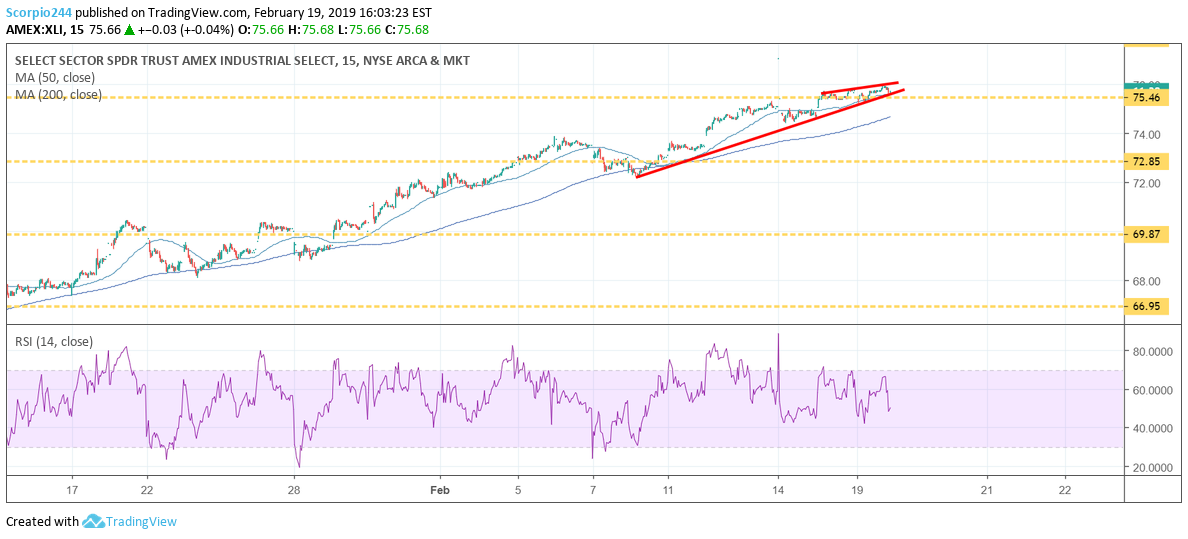
The same pattern is present in the industrial ETF the Industrial Select Sector SPDR (NYSE:XLI).
Consumers (XLY)
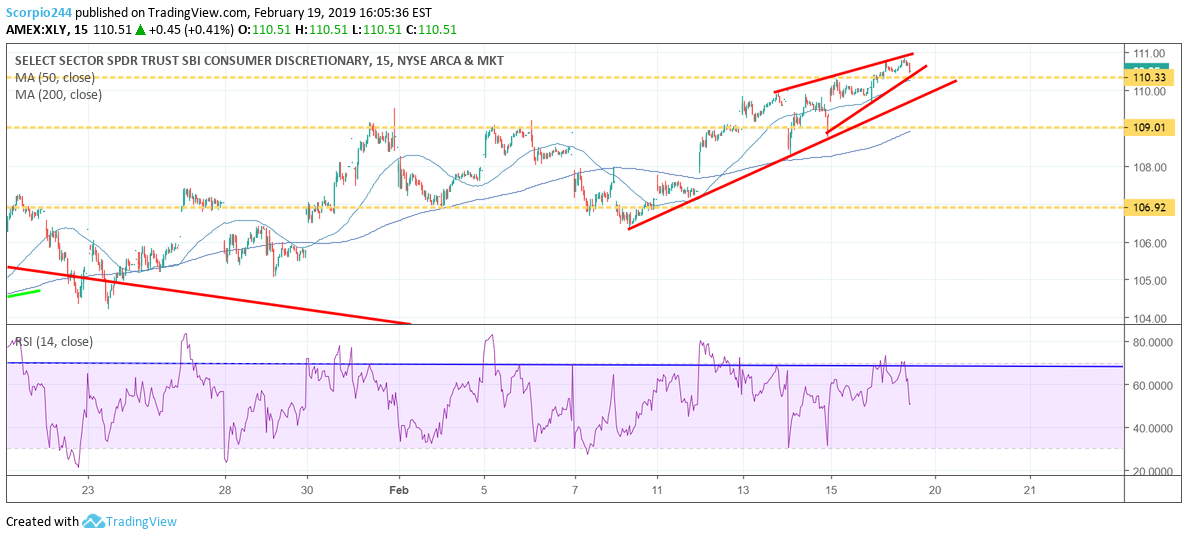
Here it is again in the consumer discretionary ETF Consumer Discretionary Select Sector SPDR (NYSE:XLY).
Be prepared, that’s all. Don’t be shocked. Again, maybe I’m wrong, but a lot of charts are all pointing to the same thing, hard to ignore. Still, at this point, I’m not concerned.
Yields
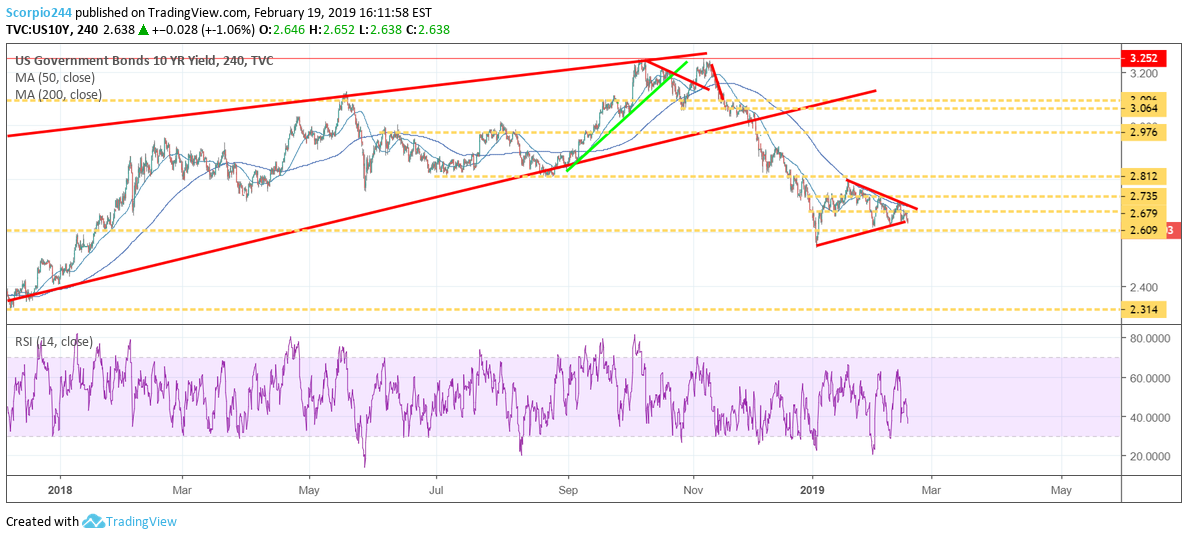
Here is one more thing, look at the 10-year yield. Does this look like a chart that is about to rise sharply? Not to me. How do Christmas Eve lows sound? Certainly speaks to falling stock prices.
Copper
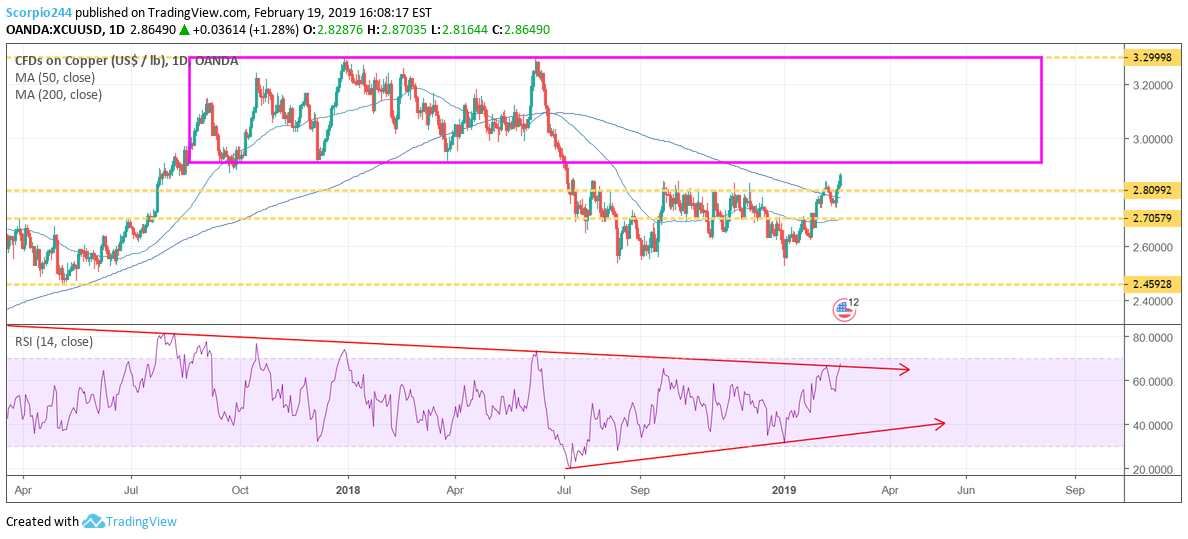
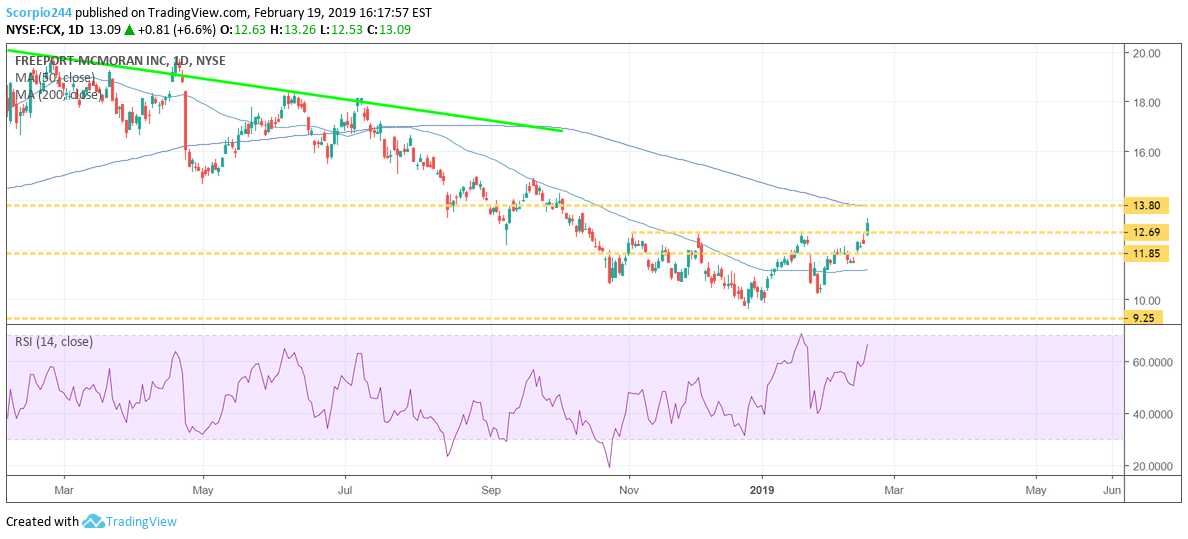
Did you see the monster break out in copper today? Yes, it rose all the way to $2.86. That is a big move for copper, watch for $2.91.
Roku
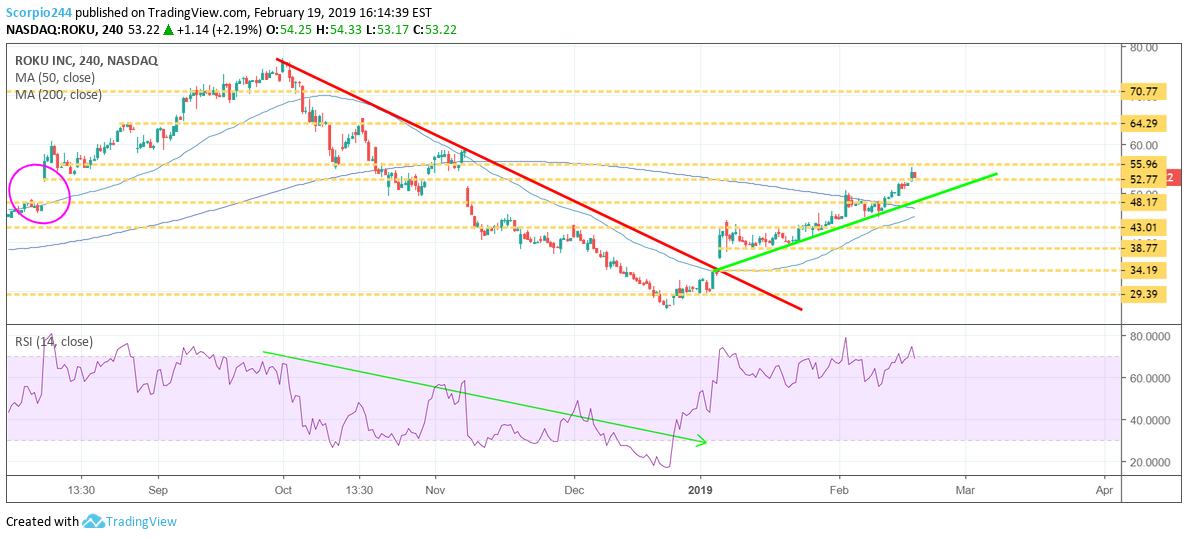
That may be all Roku Inc (NASDAQ:ROKU) wrote. The stock reached about $55.50 and backed off. Close enough to our $56 target if you ask me. The gap is filled. Next stop is probably $48.
Freeport (FCX)
Freeport-McMoran Copper & Gold Inc (NYSE:FCX) had its big break out today, and as long as copper keeps rising, Freeport stands a chance to increase to $13.90.
General Electric (GE)
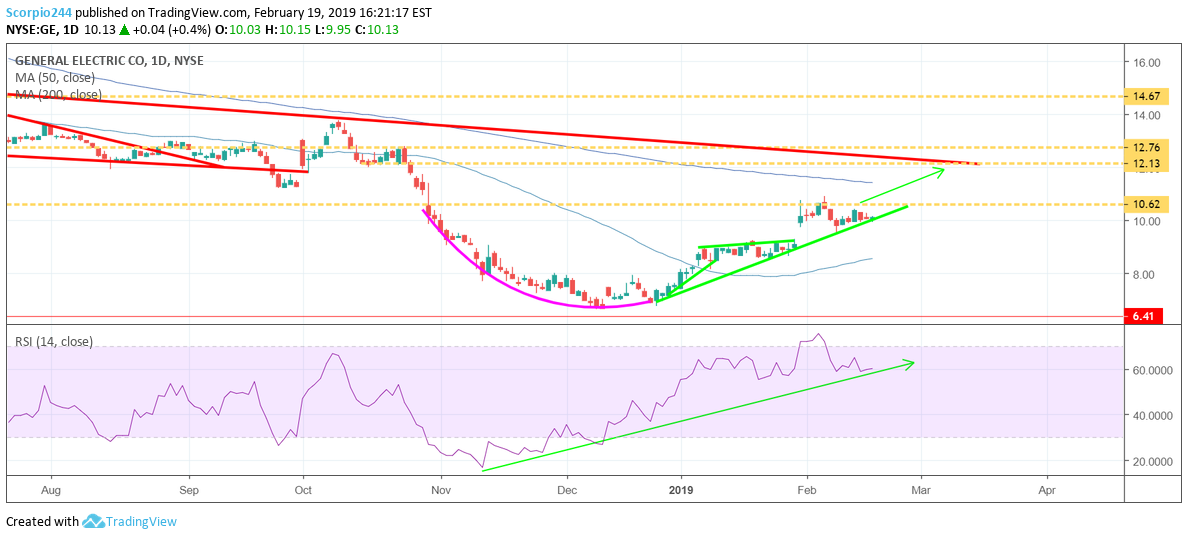
General Electric Company (NYSE:GE) is at the point where if it will continue to rise, it needs to do it soon. Otherwise, my idea of it rising to $12.20, will be finished. The RSI suggests that it does continue to increase.
Advanced Micro Devices (AMD)
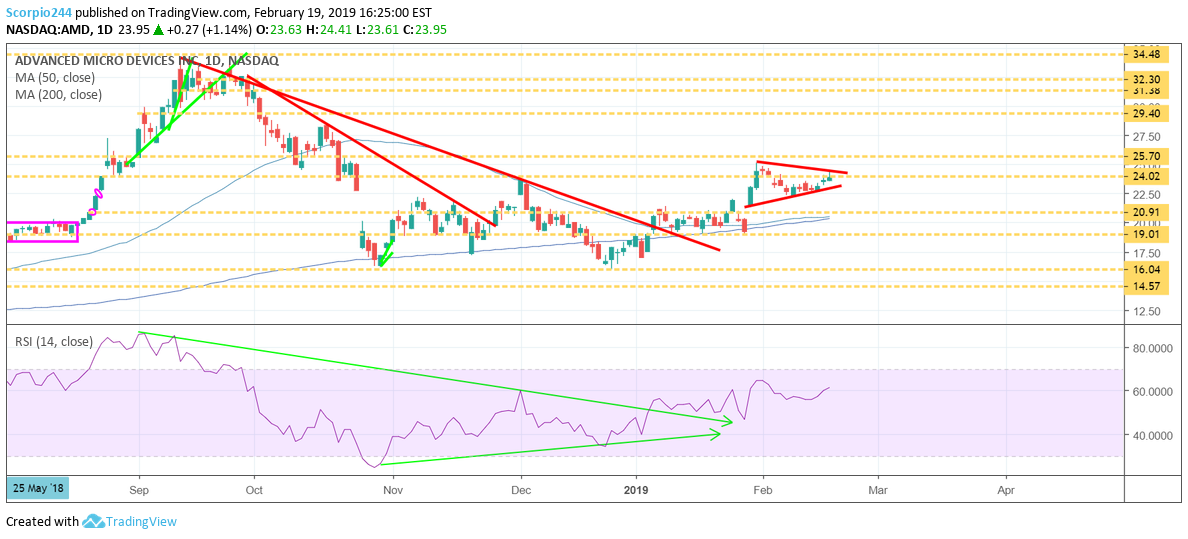
Advanced Micro Devices Inc (NASDAQ:AMD) looks like it is getting ready to rise and break out, after consolidating the last few days. A break out could take the stock on towards; I would think, $29.

