I’ve included the Fidelity Symbol Summaries for four major players in the Defense Sector, below.
General Dynamics Corporation (GD) is an aerospace and defense company that offers a portfolio of products and services in business aviation; combat vehicles, weapons systems and munitions; military and commercial shipbuilding, and communications and information technology.
Lockheed Martin Corporation (LMT) is a global security and aerospace company principally engaged in the research, design, development, manufacture, integration, and sustainment of technology systems and products. The Company also provides a range of management, engineering, technical, scientific, logistic, and information services. It serves both domestic and international customers with products and services that have defense, civil, and commercial applications, with its principal customers being agencies of the United States Government.
Northrop Grumman Corporation (NOC) provides products, services, and integrated solutions in aerospace, electronics, information and services to its global customers.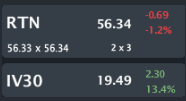
Raytheon Company (RTN), together with its subsidiaries, is a technology company specializing in defense, homeland security and other government markets worldwide. The Company provides electronics, mission systems integration and other capabilities in the areas of sensing, effects, and command, control, communications and intelligence systems (C3I), as well as a range of mission support services.
We can see they’re all down small. What isn’t quite apparent is that the IV30™’s are all rising into the election. On the day the IV30™ gains are:
GD: +10.0%
LMT: +12.2%
NOC: +9.3%
RTN: +13.4%
This is another industry note, similar to the one I posted on Friday for managed health care.
In any case, today we’ll go evergreen here and examine the defense sector and the risk embedded in that industry due to the upcoming presidential election. Let’s start with four Skew Charts. The red curves represent the Nov options while the yellow curves represent the Dec options.
GD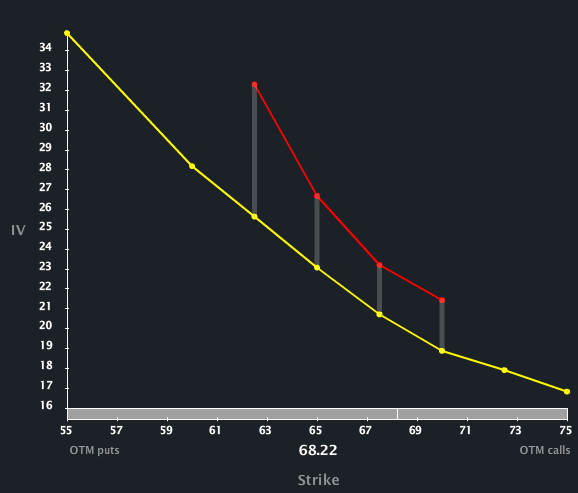
LMT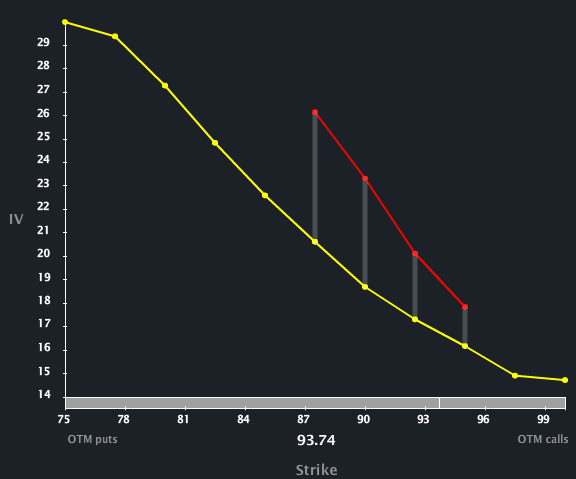
NOC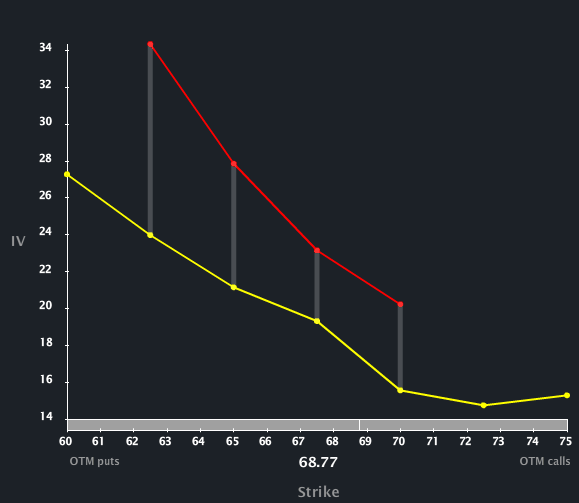
RTN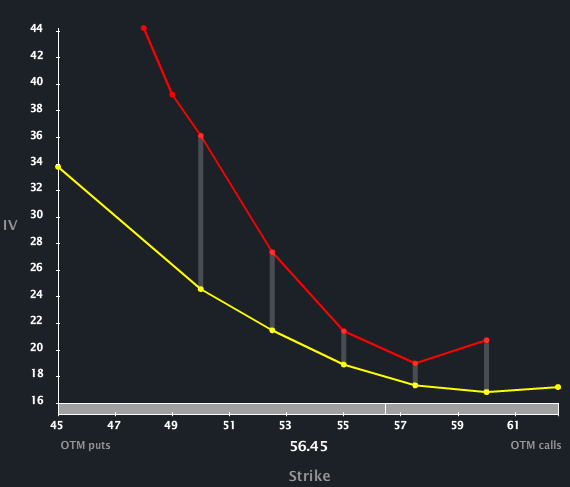
What we can see quite clearly, across all four names is that the front month is elevated to the back (i.e. the red curve is above the yellow curve). That vol difference is increasing as of yesterday and my best guess will expand even further todat (depending on how the mid-day polling goes).
I have included just the vols by expiry below for each of the four names – note the increases in Nov vol relative to Dec for each of these four.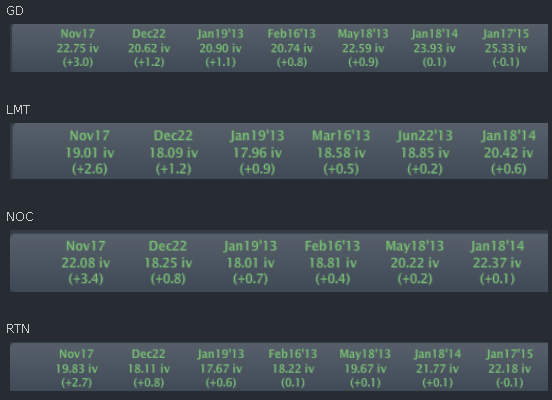
I know that’s a lot to look at and digest, but just focus on the Nov and Dec vols and the changes. To make it a touch easier to read, I’ve included a summary table below:
Note that I used percentage changes in the Nov and Dec Expiry Rise fields to make comparisons a bit easier. The vol correlation is incredibly high, where we see a range of [14%, 18%] for Nov vol increase and [5%, 7%] in Dec vol increases.
We can see a bit more clearly now how the IV30™’s are rising and while vol is up in both Nov and Dec, it’s Nov that is showing the greatest move. In English, risk as reflected by the options market, is rising across the board, with the nearest-term options (Nov) showing the greatest risk.
As I wrote in a prior article, this could be another case where an industry specific reaction will dominate any correlation to the overall market. That is, this industry’s correlation to the market may tend to zero as the singular event that is tying them together unravels (the presidential election).
Disclosure: This is trade analysis, not a recommendation.
- English (UK)
- English (India)
- English (Canada)
- English (Australia)
- English (South Africa)
- English (Philippines)
- English (Nigeria)
- Deutsch
- Español (España)
- Español (México)
- Français
- Italiano
- Nederlands
- Português (Portugal)
- Polski
- Português (Brasil)
- Русский
- Türkçe
- العربية
- Ελληνικά
- Svenska
- Suomi
- עברית
- 日本語
- 한국어
- 简体中文
- 繁體中文
- Bahasa Indonesia
- Bahasa Melayu
- ไทย
- Tiếng Việt
- हिंदी
Defense Sector Risk, Vol Correlations Rise As Election Looms Large
Published 11/06/2012, 02:55 AM
Updated 07/09/2023, 06:31 AM
Defense Sector Risk, Vol Correlations Rise As Election Looms Large
Latest comments
Loading next article…
Install Our App
Risk Disclosure: Trading in financial instruments and/or cryptocurrencies involves high risks including the risk of losing some, or all, of your investment amount, and may not be suitable for all investors. Prices of cryptocurrencies are extremely volatile and may be affected by external factors such as financial, regulatory or political events. Trading on margin increases the financial risks.
Before deciding to trade in financial instrument or cryptocurrencies you should be fully informed of the risks and costs associated with trading the financial markets, carefully consider your investment objectives, level of experience, and risk appetite, and seek professional advice where needed.
Fusion Media would like to remind you that the data contained in this website is not necessarily real-time nor accurate. The data and prices on the website are not necessarily provided by any market or exchange, but may be provided by market makers, and so prices may not be accurate and may differ from the actual price at any given market, meaning prices are indicative and not appropriate for trading purposes. Fusion Media and any provider of the data contained in this website will not accept liability for any loss or damage as a result of your trading, or your reliance on the information contained within this website.
It is prohibited to use, store, reproduce, display, modify, transmit or distribute the data contained in this website without the explicit prior written permission of Fusion Media and/or the data provider. All intellectual property rights are reserved by the providers and/or the exchange providing the data contained in this website.
Fusion Media may be compensated by the advertisers that appear on the website, based on your interaction with the advertisements or advertisers.
© 2007-2024 - Fusion Media Limited. All Rights Reserved.
