You Will Never Look At The Markets The Same Way Again
Chris Ciovacco | Oct 27, 2013 01:49AM ET
Confidence In Stocks and Economy: Then And Now
- How the Fed impacts asset prices.
- The market does not care what you think.
- Using concepts 1 & 2 to compare 2007 and 2013.
Why Is Wall Street Obsessed With The Fed?
In this weekend’s article, we tackle three major topics that may alter the way you invest:
Before we move to the “you decide” comparisons of 2007 and 2013, it is important to acknowledge the Federal Reserve’s method for propping up asset prices. The Fed provides a difficult-to-overstate source of indirect demand for financial and physical assets. Here is basically how quantitative easing (QE) works: The Fed prints money, they give the printed money to primary dealers, the Fed gets a bond in return, and presto they have injected new money into the global financial system without having to deal with messy stimulus votes in Washington. The primary dealers (and/or their clients) can do whatever they want with the freshly printed greenbacks, including purchasing stocks, distressed real estate, or anything their hearts desire. That, my friends, is how stocks can go up when the economy is in such a tepid state and why Wall Street is obsessed with the Fed’s printing presses. If you want to do some homework over the weekend, this series of Bloomberg :
After flirting for months with the idea of curtailing stimulus, the Fed said in September it would continue purchasing $85 billion of bonds a month, citing the need to see more evidence that the U.S. economy will improve.
Reading The Market’s Palm
Technical analysis (TA) is the study of charts. TA often gets slumped together with voodoo and palm reading. The power of charts, and why they are used by the vast majority of pension funds, is they allow us to monitor the mechanism that sets asset prices. If you understand how assets prices are set, then the value of monitoring charts is easy to understand.
A Different Way To Approach Investing
Let’s assume we run a controlled market experiment where:
- We give 1,000 investors an annual report to read for company XYZ.
- All 1,000 are asked to read the report and then value the stock.
- Stock XYZ can only be traded or owned by these 1,000 investors.
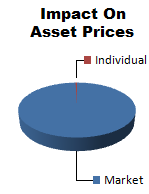
The Market Does Not Care What You Think
If I am one of the 1,000 investors in the experiment, how relevant is my personal opinion in terms of how the price of stock XYZ is set in the marketplace? In simplified terms, my personal take on the value of XYZ impacts the price by roughly 0.10% (1/1000). Stated in a politically correct manner, 99.9% of the factors impacting the price of XYZ have nothing to do with my personal analysis, forecast, or opinion about XYZ, or the global macro environment for that matter. Said in a more direct manner, the market does not care what “I think” about where XYZ is headed or what it is worth. It sounds harsh, but that is the way markets work. Does that mean fundamentals don’t matter? Absolutely positively not; the concept simply defines how fundamentals impact asset prices.
If we expand the XYZ analogy to the real world, it gets even more humbling. Facebook (FB) trades 81,000,000 shares on a typical day. It closed Thursday at $52.44. If we assume the average FB trade is for $10,000 worth of stock, that means the average number of shares traded per individual transaction is 190 (10,000/52.44). A back of the napkin estimate of the number of people that trade Facebook every day comes to 426,315 (81M shares per day / 190 shares per individual transaction). Therefore, if I am trading Facebook, the impact of my personal opinion/research/forecast on the price of the stock is 1 divided by 426,315 or 0.00023%. The admittedly crude analysis tells us 99.977% of Facebook’s value is impacted by external factors that are in no way impacted by what “I think” or “what I think will happen next”.
So What Do We Do Now?
In terms of using this information to become better investors, let’s start with the proper questions to ask before we allocate our limited resources. If a client or prospect asks what do you think about Coca-Cola (KO)?, we often respond with you may not be asking the right question(s). The more meaningful way to phrase the question is what does the market think about Coca-Cola, and how does that compare to every other investment option? Charts allow us to answer both questions.
Question two: Is Coke the best investment option? At this point, the answer is a definitive no, according to the chart below. If Coke is lagging the S&P 500 that means numerous stocks in the S&P 500 are better options relative to how assets are priced. The chart tells us the aggregate opinion of SPY is more favorable that the aggregate opinion of KO.
How Fearful Is The Market Now?
The market’s pricing mechanism, based on the aggregate opinion of every investor around the globe, allows us to compare economic confidence in late 2007 to the present day. If you prefer, a more direct way to say it is charts enable us to monitor the conviction that stocks will push higher relative to the conviction that stocks will fall. The aggregate investor opinion is based on the aggregate interpretation of the economy, earnings, Fed policy, etc. The previous sentence helps us understand the concept that the fundamentals are reflected in the charts.
2007 vs. 2013
The S&P 500, or price, is like an economic poll where investors vote with their wallets. The blue line in the charts below is the 50-day moving average, which is used to filter out day-to-day volatility, allowing us to focus on the intermediate-term trend of investor confidence. It is easy to see the present state of economic/market confidence is much healthier than it was in 2007 (compare the first chart to the second).
How About The Longer-Term Confidence Polls?
If we want to get a read on the longer-term aggregate battle between confidence in the economy/Fed/stocks relative to concerns about the economy/Fed/stocks, we can use the 200-day moving average (in green below). The slopes of the blue lines allow us to compare the 2007 bull market peak to the present day. The consolidation, which shows indecisiveness about the economy, between April 2007 and December 2007 (points A and B) tells us the aggregate opinion of millions of market participants does not flip from bullish to bearish overnight. If we pull that concept into 2013, the current slope of the 200-day moving average tells us, even under the most bearish longer-term scenarios, months of sideways price action would most likely come before any significant and lasting plunge in stock prices (likely speaks to probabilities).
Time Stamped Historical Example
This all sounds logical, but can it help us? The excerpt below comes from an October 18 :
- Think in probabilities
- Develop an IF, THEN system
- Monitor the big picture
- Remain highly flexible
The charts above tell us the probability of a bear market kicking off from a risk-tolerance profile similar to what we have today is relatively low. A relatively low probability does not mean a zero probability. Therefore, if the charts above begin to shift in a 2007-like manner and the big picture deteriorates significantly from Bloomberg :
We are at the cusp of another round of global monetary easing,” said Joachim Fels, co-chief global economist at Morgan Stanley in London. Policy makers are reacting to another cooling of global growth, led this time by weakening in developing nations while inflation and job growth remain stagnant in much of the industrial world.
Trading in financial instruments and/or cryptocurrencies involves high risks including the risk of losing some, or all, of your investment amount, and may not be suitable for all investors. Prices of cryptocurrencies are extremely volatile and may be affected by external factors such as financial, regulatory or political events. Trading on margin increases the financial risks.
Before deciding to trade in financial instrument or cryptocurrencies you should be fully informed of the risks and costs associated with trading the financial markets, carefully consider your investment objectives, level of experience, and risk appetite, and seek professional advice where needed.
Fusion Media would like to remind you that the data contained in this website is not necessarily real-time nor accurate. The data and prices on the website are not necessarily provided by any market or exchange, but may be provided by market makers, and so prices may not be accurate and may differ from the actual price at any given market, meaning prices are indicative and not appropriate for trading purposes. Fusion Media and any provider of the data contained in this website will not accept liability for any loss or damage as a result of your trading, or your reliance on the information contained within this website.
It is prohibited to use, store, reproduce, display, modify, transmit or distribute the data contained in this website without the explicit prior written permission of Fusion Media and/or the data provider. All intellectual property rights are reserved by the providers and/or the exchange providing the data contained in this website.
Fusion Media may be compensated by the advertisers that appear on the website, based on your interaction with the advertisements or advertisers.