With Bullish Wedge On S&P 500 Completed, 4600+ Target On Track
Dr. Arnout ter Schure | Mar 17, 2022 03:14PM ET
Last week, while most traders, investors and market pundits were doing Chicken Littles and selling doom and gloom stories, I used objective analyses of charts and data to conclude a rally– -and not a crash – was the most likely scenario. See here. Namely, I found the S&P 500:
- was forming a (bullish) falling wedge;
- exhibited positive divergence between price and several technical indicators;
- sentiment was highly bearish; albeit the index had only done a garden-variety 13% correction;
- seasonality was pointing towards an essential low around mid-March.
Providing all these facts told me the weight of the evidence was pointing toward higher prices, not lower, and that a rally to SPX 4600+ would be in order.
One week later, the index is already trading at SPX 4400, as it broke out of the wedge yesterday. Once again: objective analyses 1, emotions and opinions 0.
Figure 1. S&P 500 daily line charts with technical patterns and indicators:
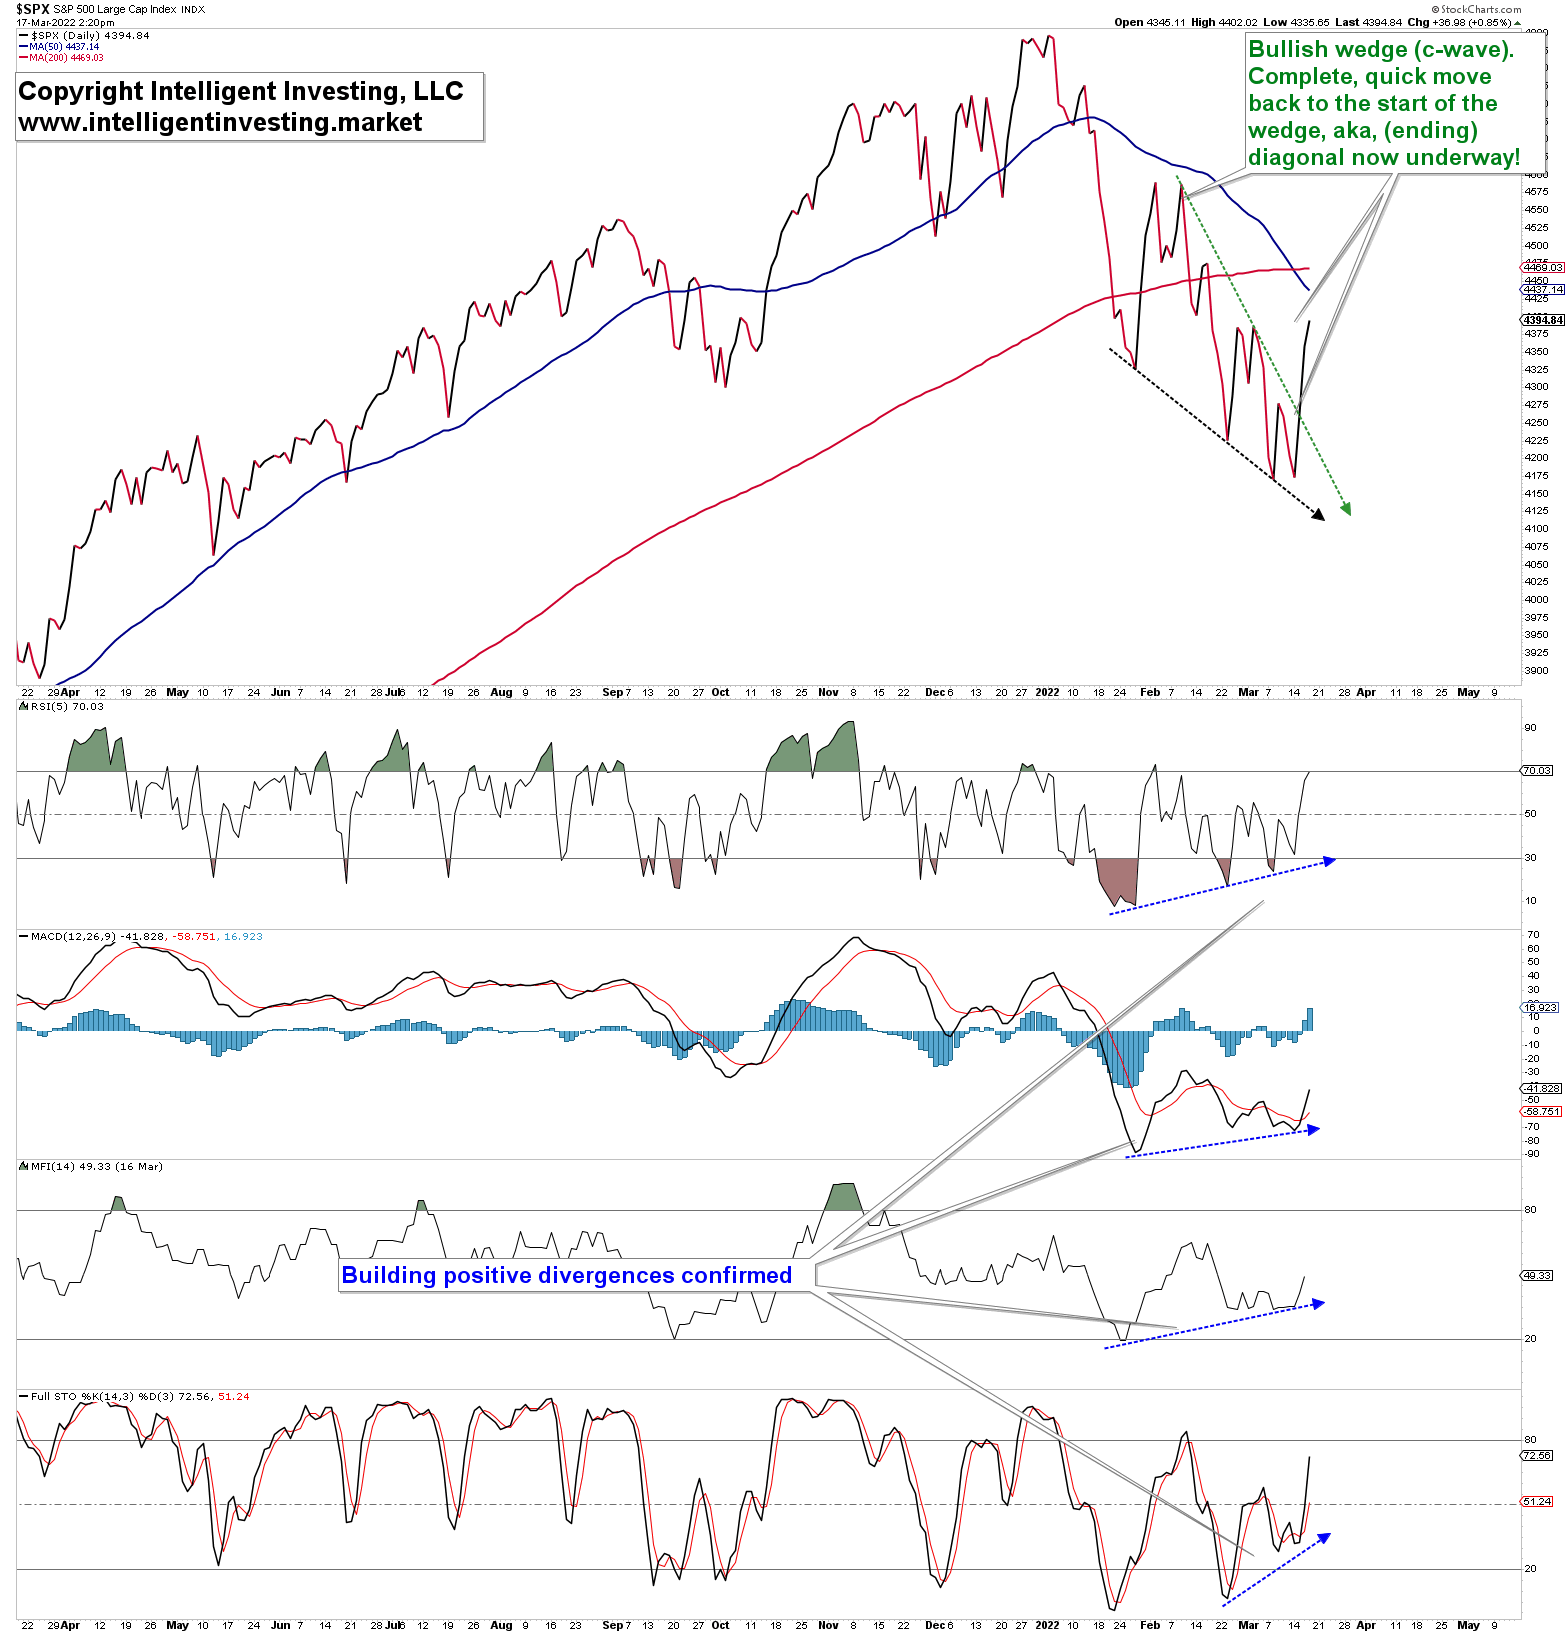
SPX 4600 Next, Pullback, Then A Rally?
The 50- and 200-day Simple Moving Averages (SMAs) at SPX 4437 and SPX 4470, respectively, should provide some resistance, but based on my Elliott Wave Principle (EWP) work, I expect the stock markets to have put in a lasting bottom, and that a subdividing five-wave rally to SPX 5500-6000 is now under way. Namely, the Feb. 24 low was for the SPX a fourth wave low, and now wave-5 is under way. Based on current data available, I anticipate the first wave of wave-5 to top out at around SPX 4600. The second wave should be a multi-day few hundred points correction before wave-iii of 5 targets, ideally, SPX 5100+/-100.
Bottom Line: Last week, when the S&P 500 was trading at around 4200, I found the index was exhibiting a bullish pattern, called a falling wedge or an ending diagonal C-wave in EWP terms. This pattern projected a move to SPX 4600+. Four trading days later, the SPX is trading at 4400, an almost 5% gain, whereas nearly everybody had jumped on the bearish bandwagon. I, therefore, still expect the index to top out at 4600+/-100, a pullback to around 4400+/-100, and then a rally to SPX5100+/-100. The devil remains in the exact details, but I am not too concerned about those. I prefer to focus on the forest and not the trees. Ultimately, the melt-up to SPX 5500-6000 should be under way as anticipated.
In November, I was looking for a 10-15% correction. See here.
Trading in financial instruments and/or cryptocurrencies involves high risks including the risk of losing some, or all, of your investment amount, and may not be suitable for all investors. Prices of cryptocurrencies are extremely volatile and may be affected by external factors such as financial, regulatory or political events. Trading on margin increases the financial risks.
Before deciding to trade in financial instrument or cryptocurrencies you should be fully informed of the risks and costs associated with trading the financial markets, carefully consider your investment objectives, level of experience, and risk appetite, and seek professional advice where needed.
Fusion Media would like to remind you that the data contained in this website is not necessarily real-time nor accurate. The data and prices on the website are not necessarily provided by any market or exchange, but may be provided by market makers, and so prices may not be accurate and may differ from the actual price at any given market, meaning prices are indicative and not appropriate for trading purposes. Fusion Media and any provider of the data contained in this website will not accept liability for any loss or damage as a result of your trading, or your reliance on the information contained within this website.
It is prohibited to use, store, reproduce, display, modify, transmit or distribute the data contained in this website without the explicit prior written permission of Fusion Media and/or the data provider. All intellectual property rights are reserved by the providers and/or the exchange providing the data contained in this website.
Fusion Media may be compensated by the advertisers that appear on the website, based on your interaction with the advertisements or advertisers.