Will Markets Look Beyond Washington's Logjam?
Jeff Miller | Oct 06, 2013 04:21AM ET
Is it premature to think ahead, to a time after the budget and debt logjam is broken? Markets are celebrated for anticipatory power. There are already some signs this is happening. We would all enjoy relief from the parade of politicians and pundits –and especially the annoying and unhelpful countdown clock.
For the last two weeks I have Sarah Binder explains why this ploy is unlikely to work.
- The shutdown and the debt ceiling have become linked in the debate. This is positive, because it reduces the chance that the debt ceiling debate will (once again) continue until the last possible moment.
- The Obama Administration is emphasizing potential costs, citing a potential 2008 situation .
- Polls continue to show that both parties will be blamed for the shutdown, but more are blaming the Republicans. There is increasing voter anger . Astute political observer Bruce Bartlett looks beyond the poll results. He wonders who will change votes based upon this issue, tweeting as follows:
- Dems are picking up votes from Reps who use Obamacare & like it, Rep gov't employees & others. Who are Republicans picking up?
- Speaker Boehner is privately assuring that there will not be a debt default. (Many sources, but the NYT's Ashley Parker has a good story.)
- There are various reports of informal talks between Democrats and moderate Republicans.
- Credit default swaps indicate a U.S. default risk of about 4%. Stan Collender sees 25% and other estimates are in the 10% range.
The default swaps and other "fear" indicators suggest that many think they have seen this show before. Many prominent business leaders are calling for a sensible solution. While there is some market reaction to speeches, it is less significant than it was in the 2011 debt ceiling debate.
A New Theme
Over the next two weeks I expect the market to shift attention to Q3 earnings. In the absence of fresh economic data, the discussions will start early. The best and most recent update comes from earnings expert Brian Gilmartin, who notes the jump in the forward earnings for the next year – but also the decline in year-over year expectations. The full article deserves study, but here is a key quote :
Here are the numbers as they fall out presently:
- Forward 4-quarter estimate: $119.04
- PE ratio on forward estimate: 14.2(x)
- Earnings yield: 7.04%
- Growth rate of forward estimate: 6.06%
If these expectations are met, it remains a bullish scenario. Is the bar too high?
I have some thoughts on the changing market focus which I'll report in the conclusion. First, let us do our regular update of last week's news and data.
Background on "Weighing the Week Ahead"
There are many good lists of upcoming events. One source I regularly follow is the weekly calendar from Investing.com . For best results you need to select the date range from the calendar displayed on the site. You will be rewarded with a comprehensive list of data and events from all over the world. It takes a little practice, but it is worth it.
In contrast, I highlight a smaller group of events, including some you have not seen elsewhere. My theme is an expert guess about what we will be watching on TV and reading in the mainstream media. It is a focus on what I think is important for my trading and client portfolios. Each week I consider the upcoming calendar and the current market, predicting the main theme we should expect. This step is an important part of my trading preparation and planning. It takes more hours than you can imagine.
My record is pretty good. If you review the list of titles it looks like a history of market concerns. Wrong! The thing to note is that I highlighted each topic the week before it grabbed the attention. I find it useful to reflect on the key theme for the week ahead, and I hope you will as well.
This is unlike my other articles where I develop a focused, logical argument with supporting data on a single theme. Here I am simply sharing my conclusions. Sometimes these are topics that I have already written about, and others are on my agenda. I am putting the news in context.
Readers often disagree with my conclusions. Do not be bashful. Join in and comment about what we should expect in the days ahead. This weekly piece emphasizes my opinions about what is really important and how to put the news in context. I have had great success with my approach, but feel free to disagree. That is what makes a market!
Last Week's Data
Each week I break down events into good and bad. Often there is "ugly" and on rare occasion something really good. My working definition of "good" has two components:
- The news is market-friendly. Our personal policy preferences are not relevant for this test. And especially -- no politics.
- It is better than expectations.
The Good
Despite the stock market reaction, this was a pretty good week for economic data.
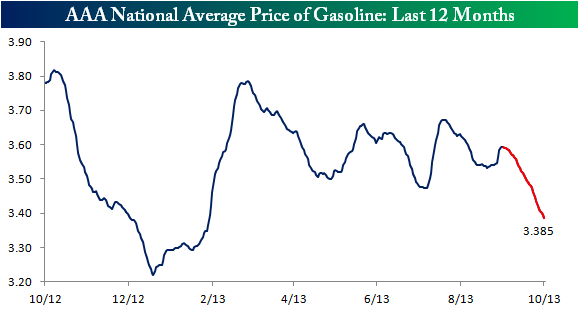
- Gas prices declined further, now down 10% over the year at $3.385 per gallon. (I filled up yesterday at $3.18). Bespoke analyzes the recent trends including a long-term chart. Let us focus on the last twelve months:
- Global growth is at an 18-month high. John Lounsbury of Global Economic Intersection does a nice job of analysis using the JP Morgan and Markit data
- Series truck sales show continued strength. Bespoke is reporting monthly on this indicator with the expected great charts of current and long-term trends. They explain the importance as follows :
Sales of pickup trucks are often a sign of strength or weakness in the small business and construction sectors, as these types of businesses are the most common users of these vehicles. With that in mind, today's numbers from Ford (F) continue to show strength in these sectors. During the month of September, Ford sold 60,456 F-Series pickup trucks. This represents an increase of 9.8% from last year and is the highest level for the month of September since 2006. - Weekly jobless claims continued at extremely low levels. This series is often pretty noisy and there has been a recent question about reporting from some states. That has been clarified, and the results are the best since the pre-recession era. We may soon get a spike from unemployed government workers, but the overall trend remains strong.
- ISM manufacturing was excellent on all counts at 56.2 on the headline and solid on the internals. The employment index was the highest for the year. Calculated Risk has details along with this chart:
The Bad
As always, there was a little bad news:
- The HSBC flash PMI for China came in a point light at 50.2, barely showing expansion.
- ISM Services missed expectations, while still showing growth. See Steven Hansen's post at GEI for charts and detailed analysis. This featured table shows the story of the internals:
- Vehicle sales were down a little on the headline number, but fewer selling days in the month accounted for the change.
- ADP private payroll gains for last month registered 166K and the prior month was revised lower by 17,000. This continues the weaker net job growth we have seen in recent months. In the absence of the "official" BLS report, the ADP measure has extra significance. (See Calculated Risk for a good discussion).
- The European trade talks are a casualty of the shutdown. This has important economic significance, described effectively by ft.com . The FT has had broad and effective coverage of shutdown issues.
The Ugly
Investor confusion! Misguided "investors" bought Tweeter Home Entertainment (TWTRQ), not Twitter whose ticker symbol will be TWTR. Despite the similarity in names and stock symbols, purchasers really should know better. When the Twitter IPO finally occurs the symbol will be TWTR and it will NOT be a penny stock. The bankrupt Tweeter has the trailing "Q" in the symbol – TWTRQ – the market equivalent of a scarlet letter. It traded up 1800% to a high of thirteen cents, eventually sparking a trading halt. famous chart show (a mixed picture this week) which I always review in preparation for the week ahead. These are members-only features, but the cost is modest and the value high.
The Indicator Snapshot
It is important to keep the current news in perspective. I am always searching for the best indicators for our weekly snapshot. I make changes when the evidence warrants. At the moment, my weekly snapshot includes these important summary indicators:
- For financial risk, the St. Louis Financial Stress Index.
- An updated analysis of recession probability from key sources.
- For market trends, the key measures from our "Felix" ETF model.
Financial Risk
The SLFSI reports with a one-week lag. This means that the reported values do not include last week's market action. The SLFSI has recently edged a bit higher, reflecting increased market volatility. It remains at historically low levels, well out of the trigger range of my pre-determined risk alarm. This is an excellent tool for managing risk objectively, and it has suggested the need for more caution. Before implementing this indicator our team did extensive research, discovering a "warning range" that deserves respect. We this article . For more on the system ratings, you can write to etf at newarc dot com for our free report package or to be added to the (free) weekly ETF email list. You can also write personally to me with questions or comments, and I'll do my best to answer.]
The Week Ahead
This week's schedule will be dramatically affected by the government shutdown. Private data will assume unusual significance.
The "A List" includes the following:
- The FOMC minutes (W). The market places excessive emphasis on the smallest change in Fed policy. Especially in the absence of other data, this announcement will get plenty of play.
- Michigan sentiment (F). This is always important as an indicator of employment and consumption. This week it will also reflect reactions to the political impasse, making it more important than ever.
- Initial jobless claims (Th). This is the most frequent and responsive employment indicator, but it tells only part of the story. It will not yet reflect government layoffs.
The "B List" includes the following:
- Assorted private indicators that normally would get little play, like the small business optimism index, etc.
We'll get some speeches, including ECB President Mario Draghi at the Economic Club of New York on Thursday.
How to Use the Weekly Data Updates
In the WTWA series I try to share what I am thinking as I prepare for the coming week. I write each post as if I were speaking directly to one of my clients. Each client is different, so I have five different programs ranging from very conservative bond ladders to very aggressive trading programs. It is not a "one size fits all" approach.
To get the maximum benefit from my updates you need to have a self-assessment of your objectives. Are you most interested in preserving wealth? Or like most of us, do you still need to create wealth? How much risk is right for your temperament and circumstances?
My weekly insights often suggest a different course of action depending upon your objectives and time frames. They also accurately describe what I am doing in the programs I manage.
Insight for Traders
Felix has switched to a neutral posture. For our trading accounts we lightened up at mid-week, but we are once again fully invested. This happens when we find three or more attractive sectors, even in a neutral or soft market. Felix's ratings have been in a fairly narrow range for several months. The rapid news-driven shifts are not the ideal conditions for Felix's three-week horizon. The high penalty box rating continues to underscore the uncertainty.
Insight for Investors
The challenge for investors is to distinguish between the major trends and the short-term uncertainty. The main themes are not related to headlines news, even though sentiment may drive market fluctuations. Do not be seduced by the idea that you can time the market, calling every 10% correction. Many claim this ability, but few have a documented record to prove it. Most who claim past success are using a back-tested model. Please see new investor resource page -- a starting point for the long-term investor. (Comments and suggestions welcome. I am trying to be helpful and I love feedback).
Final Thought
Whenever you can see overlap in the positions of two opposing parties, the eventual resolution is just a matter of time.
The key point is that the GOP is no longer insisting on changes to ObamaCare. We are back to a discussion of deficits and spending. The Democratic offers overlap with prior GOP demands, so it is just a matter of time.
I expect the following:
- A temporary extension of the debt limit. This will be criticized by the punditry as "kicking the can" but it will serve the function of buying some needed time. The market will respond to the progress, not to the political wails of some pundits.
- Minimally, an agreement that provides some tweaking of sequestration and provides Speaker Boehner a chance to claim some credit.
- Maximally, a broader compromise on some entitlement and debt issues – less likely and taking longer.
- The agreement could be reached overnight or on a weekend, without much notice.
- The resulting pop in stocks (just like the fiscal cliff resolution) will leave many chasing the market, waiting for a pullback.
This all highlights the difference between trading and investing. If you are waiting for a market decline, you should commit in advance to buying in if you are proven wrong. If you normally have a 60% stock allocation for example, and you decide to go out of the market, you need a plan to get back in. For most people, it is wiser not to make these short-term guesses, accepting the reality of some volatility.
The big danger is an overall loss of confidence. This is what happened in 2011. If the issue continues long enough, perceptions will become reality. Sober Look examines the issue , including this chart:
While I am optimistic on the final outcome, there might still be a rocky ride.
Trading in financial instruments and/or cryptocurrencies involves high risks including the risk of losing some, or all, of your investment amount, and may not be suitable for all investors. Prices of cryptocurrencies are extremely volatile and may be affected by external factors such as financial, regulatory or political events. Trading on margin increases the financial risks.
Before deciding to trade in financial instrument or cryptocurrencies you should be fully informed of the risks and costs associated with trading the financial markets, carefully consider your investment objectives, level of experience, and risk appetite, and seek professional advice where needed.
Fusion Media would like to remind you that the data contained in this website is not necessarily real-time nor accurate. The data and prices on the website are not necessarily provided by any market or exchange, but may be provided by market makers, and so prices may not be accurate and may differ from the actual price at any given market, meaning prices are indicative and not appropriate for trading purposes. Fusion Media and any provider of the data contained in this website will not accept liability for any loss or damage as a result of your trading, or your reliance on the information contained within this website.
It is prohibited to use, store, reproduce, display, modify, transmit or distribute the data contained in this website without the explicit prior written permission of Fusion Media and/or the data provider. All intellectual property rights are reserved by the providers and/or the exchange providing the data contained in this website.
Fusion Media may be compensated by the advertisers that appear on the website, based on your interaction with the advertisements or advertisers.