Why Global Markets Are Poised to Outperform the US in 2025
Callum Thomas | May 07, 2025 12:56AM ET
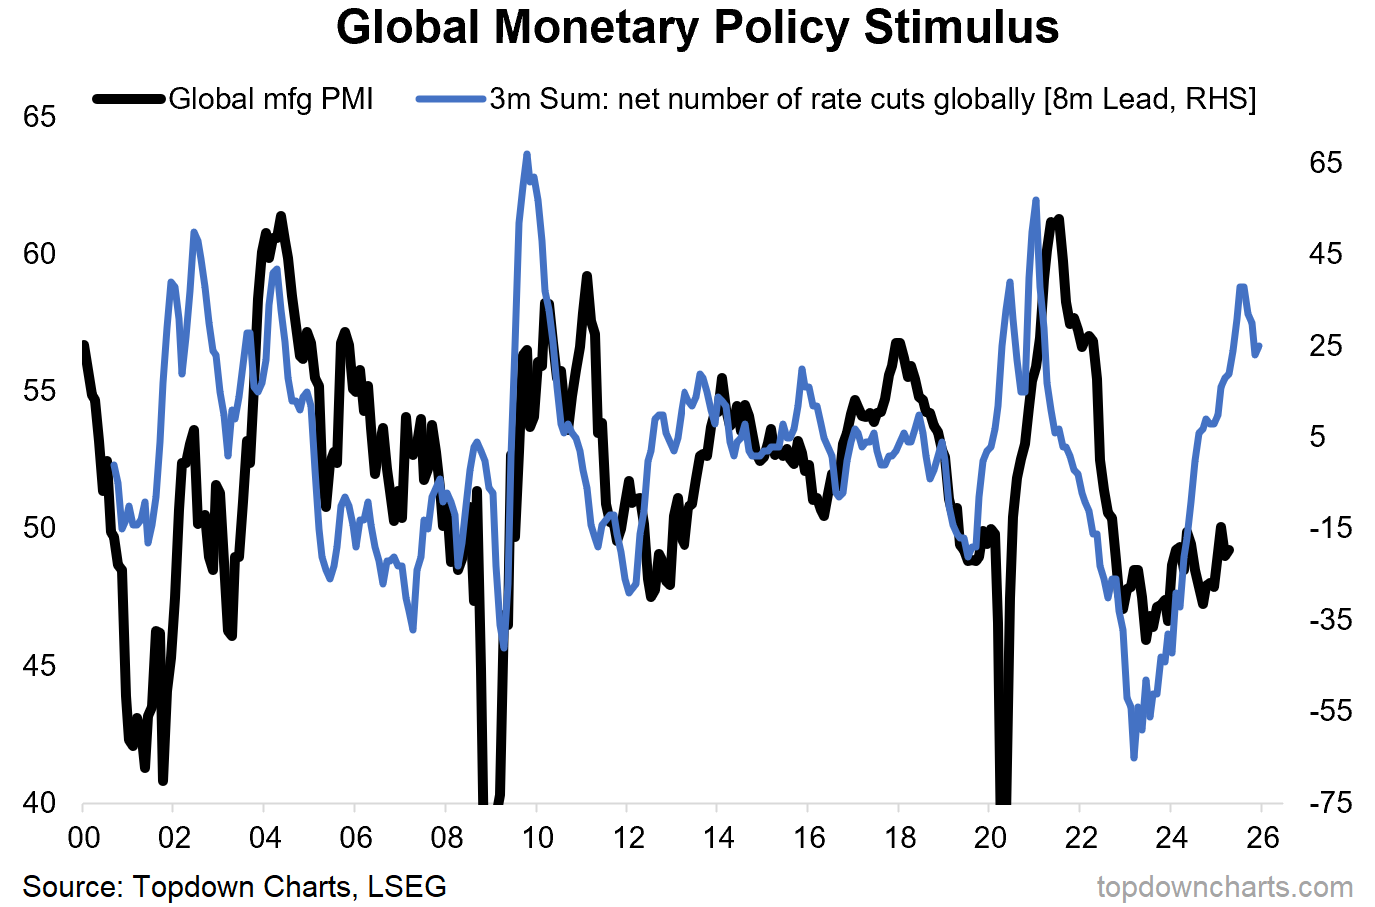
This week’s chart comes from the latest Market Cycle Guidebook and presents a sort of “what if?“ scenario, one that is probably “unthinkable“ from the standpoint of where consensus seems to have drifted to.
Basically, the key premise in the chart is that there has been a clear Global pivot to monetary policy easing already, and with the usual leads/lags of policy transmission, there should be a bunch of monetary tailwinds coming into play right about now.
So instead of getting a recession, what if we get the opposite?
(What if growth accelerates rather than stalls?)
That’s not to dismiss the real adverse impacts of the tariff shock…
And when it comes to the USA specifically, there are a lot of short-term pain points from policy moves this year e.g. fiscal tightening from DOGE cuts vs previous years fiscal stimulus, tariff impacts, collapse in tourism numbers (and other US product boycotts), and adverse confidence effects from uncertainty and market volatility (makes it hard for businesses to plan or expand vs just battening down the hatches).
But there are also good things going on, and strong spots, and parts of the economy that are less directly impacted by tariffs. So even with the USA, you could still end up with a winners vs losers K-shaped economy that muddles through like it did during the inflation and rates shock of 2022-23.
Meanwhile on the global front conventional wisdom and consensus probably says something like “you can’t have a US contraction and a rest-of-world expansion“ — but I think in this instance that assertion would ignore the idiosyncratic factors faced by the USA itself, and some of the domestic strong spots in the rest of the world + increased multilateral trade + greater stimulus/monetary easing seen outside of the US (vs current policy settings in the USA are not growth friendly).
So, to take a non-consensus “what if“ even further… what if you saw the global economy accelerate and the US economy stall?
The probability of that may be small, but it is not zero.
Food for thought as the unthinkable seems to have a habit of becoming thinkable in these non-boring times…
Key point: An unthinkable non-consensus growth surprise is a possibility.
Bonus Chart: Global Equity Technicals
It’s not just the unthinkable on the macro side; here’s an insight into how global equities are tracking, with a specific focus on global ex-US.
While the S&P 500 remains below its 200-day moving average, 74% of the countries we track are currently trading *above* their 200dma (see breadth indicator below). And while the S&P 500 is still about 9% below its peak, global ex-US equities are within inches of making a new all-time high.
Part of this has to do with US Dollar weakness (as the index below shows in US$ terms), but that’s also partly the point. The currency weakness actually reflects the relative macro predicament that the USA finds itself in versus the rest of the world. And with global stocks still trading at a massive discount vs the US, and technicals looking much better for global vs US, it seems an easy bet to say global equities will outperform vs US equities.
Original Post
Trading in financial instruments and/or cryptocurrencies involves high risks including the risk of losing some, or all, of your investment amount, and may not be suitable for all investors. Prices of cryptocurrencies are extremely volatile and may be affected by external factors such as financial, regulatory or political events. Trading on margin increases the financial risks.
Before deciding to trade in financial instrument or cryptocurrencies you should be fully informed of the risks and costs associated with trading the financial markets, carefully consider your investment objectives, level of experience, and risk appetite, and seek professional advice where needed.
Fusion Media would like to remind you that the data contained in this website is not necessarily real-time nor accurate. The data and prices on the website are not necessarily provided by any market or exchange, but may be provided by market makers, and so prices may not be accurate and may differ from the actual price at any given market, meaning prices are indicative and not appropriate for trading purposes. Fusion Media and any provider of the data contained in this website will not accept liability for any loss or damage as a result of your trading, or your reliance on the information contained within this website.
It is prohibited to use, store, reproduce, display, modify, transmit or distribute the data contained in this website without the explicit prior written permission of Fusion Media and/or the data provider. All intellectual property rights are reserved by the providers and/or the exchange providing the data contained in this website.
Fusion Media may be compensated by the advertisers that appear on the website, based on your interaction with the advertisements or advertisers.