While Charts And Breadth Are Down, Near-Term Outlook Turns Up
Guy S. Ortmann, CMT | Dec 01, 2021 09:41AM ET
McClellan 1-Day OB/OS Very Oversold As Insiders Buy
The major equity indexes closed notably lower Tuesday with broadly negative internals on the NYSE and NASDAQ with heavy trading volume. All closed at or near their lows of the day with several of the charts sinking below near-term support levels.
Yet while the charts look like a down staircase with most in negative trends while market breadth continued to deteriorate, there are some reasons to be a bit more encouraged, in our opinion.
The McClellan 1-Day OB/OS Oscillators are now extremely oversold while corporate insiders continue to increase their buying activity. As such, while the charts and breadth are negative, we are seeing some levels on the data dashboard that we believe warrant a change in our near-term macro-outlook for equities from “neutral” to “neutral/positive”.
On the charts, the major equity indexes closed notably lower yesterday with very negative internals on the NYSE and NASDAQ on heavy volume as all closed at or near their lows of the day.
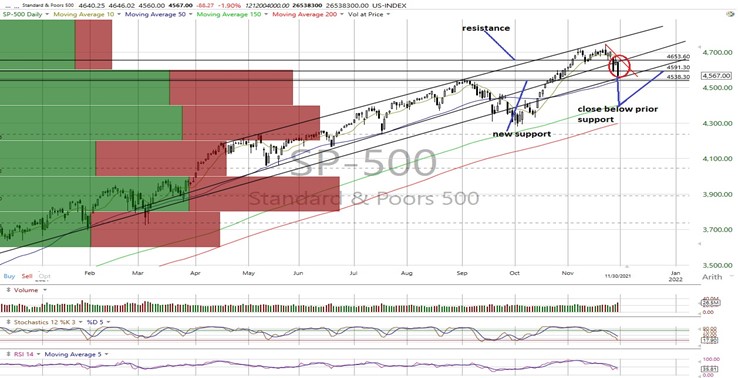
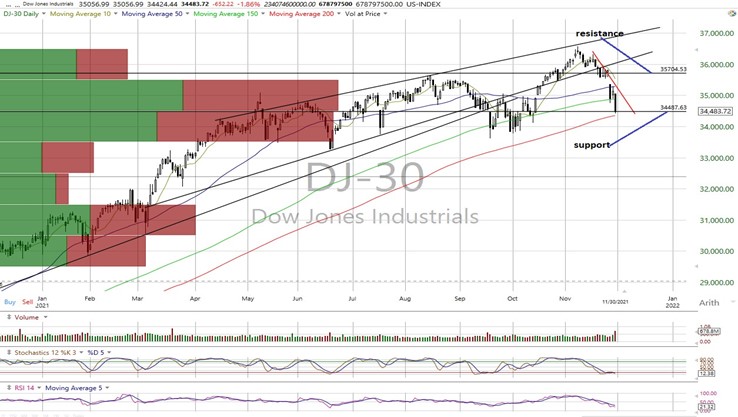
- The SPX, DJT, MID, RTY, and VALUA all closed below support. As well, the DJI closed below its 50 DMA.
- The net result was that only the COMPQX and NDX are in neutral near-term trends with the rest negative.
- Market breadth deteriorated further as well with the cumulative advance/decline lines for the All Exchange, NYSE and NASDAQ negative and below their 50 DMAs.
- However, while we have yet to see any bullish stochastic crossover signals generated, the stochastics are quite oversold for the majority.
We believe it important that the McClellan 1-Day OB/OS Oscillators are now very oversold and at levels that have been followed by good reflex rallies 3 times over the past year (All Exchange: -110.01 NYSE: -116.4 NASDAQ: -105.15). In fact, the only time they were more oversold was during the original COVID outbreak in March of 2020.
- As well, the Open Insider Buy/Sell Ratio rose to 61.7 as insiders have continued to step up their buying as the crowd sells. In our view, insiders buying as the crowd panics is typically a positive sign for the markets.
- The detrended Rydex Ratio (contrarian indicator) measuring the action of the leveraged ETF traders lifted to 1.15 and remains cautionary.
- This week’s contrarian AAII Bear/Bull Ratio rose to 0.75, remaining neutral. The Investors Intelligence Bear/Bull Ratio (21.7/54.6) (contrary indicator) is still neutral although the number of bullish advisors declined.
- Valuation finds the forward 12-month consensus earnings estimate from Bloomberg lifting to $214.65 for the SPX. As such, the SPX forward multiple is 21.3 with the “rule of 20” finding fair value at approximately 18.6.
- The SPX forward earnings yield is 4.7%.
- The 10-year Treasury yield dipped to 1.44. We view support at 1.38% and resistance at 1.62%.
In conclusion, while the charts and breadth look awful, the OB/OS levels combined with active insider buying and oversold stochastic levels are significant enough to alter our near-term macro-outlook for equities from “neutral” to “neutral/positive”.
SPX: 4,538/4,654 DJI: 34,448/35,705 COMPQX: 15,327/15,798 NDX: 15,653/16,200
DJT: 15,726/16,529 MID: 2,702/2,811 RTY: 2,180/2,280 VALUA: 9,390/9,703
RTY chart courtesy of Bloomberg; all other charts courtesy of Worden
Trading in financial instruments and/or cryptocurrencies involves high risks including the risk of losing some, or all, of your investment amount, and may not be suitable for all investors. Prices of cryptocurrencies are extremely volatile and may be affected by external factors such as financial, regulatory or political events. Trading on margin increases the financial risks.
Before deciding to trade in financial instrument or cryptocurrencies you should be fully informed of the risks and costs associated with trading the financial markets, carefully consider your investment objectives, level of experience, and risk appetite, and seek professional advice where needed.
Fusion Media would like to remind you that the data contained in this website is not necessarily real-time nor accurate. The data and prices on the website are not necessarily provided by any market or exchange, but may be provided by market makers, and so prices may not be accurate and may differ from the actual price at any given market, meaning prices are indicative and not appropriate for trading purposes. Fusion Media and any provider of the data contained in this website will not accept liability for any loss or damage as a result of your trading, or your reliance on the information contained within this website.
It is prohibited to use, store, reproduce, display, modify, transmit or distribute the data contained in this website without the explicit prior written permission of Fusion Media and/or the data provider. All intellectual property rights are reserved by the providers and/or the exchange providing the data contained in this website.
Fusion Media may be compensated by the advertisers that appear on the website, based on your interaction with the advertisements or advertisers.