When Fundamentals And Technicals Clash
Cam Hui | Aug 04, 2014 12:25AM ET
Weekly Trend Model signal
Trend Model signal: Risk-on
Direction of last change: Negative
The real-time (not back-tested) signals of the Trend Model is shown in the chart below:
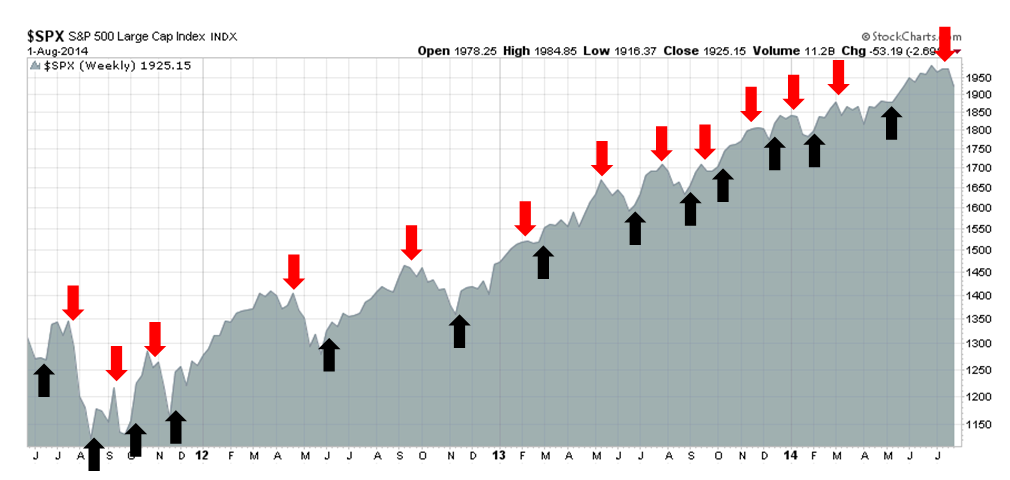
(Please scroll to the bottom of this post to see how you can get a free subscription to Trend Model updates.)
A puzzling retreat
If I told you I had a crystal ball and told you the following facts last weekend:
- Earnings season will continue to be strong, with solid beat rates for both the top and bottom lines (Factset reports the S&P 500 EPS beat rate was 74% and the revenue beat rate was 65%, well above the historical average);
- The growth outlook will continue to be positive, as the 1Q GDP report will beat expectations by a full 1%;
- The FOMC statement will come in roughly as expected and the yield curve will steepen somewhat, but interest rates remain stable;
- Non-Farm Payroll will miss expectations, but the closely watched participation rate ticks up and wage pressures remain benign;
- Chinese PMI will come in ahead of expectations; and
- There will be no new geopolitical shocks.
More timely data came from Marc Chandler summarized the tone the FOMC statement this way:
The FOMC statement made it clear that while the downside risk to inflation had lessened, the slack in the labor market favored continued accommodation, and the low Fed funds rate was anticipated to continue for a considerable period. There was one dissent over that forward guidance, but no one, even those that have publicly argued the Fed was slipping behind the curve, called for a rate hike. The course that Bernanke put the Fed on remains intact.
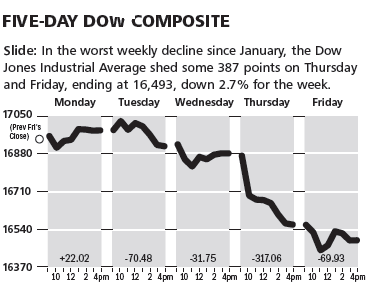
So why did the stock market freak out on Thursday and Friday?
A technically driven decline
The only reasons that I can cite for the decline in the major US equity averages are based on technical analysis. As I pointed out last weekend (see Global growth scare = Trend Model downgrade ), I suggested that Mr. Market is anticipating a global growth scare. As a result, I downgraded the technical signal for my Trend Model for the following technical reasons based on inter-market analysis:
- Falling commodity prices
- Weak equity prices in Europe
In addition, I observed that risk aversion is rising, as junk bonds are starting to underperform equivalent Treasuries. As the week progressed, the underperformance continued as credit spreads continued to widen:
BCA postulated that it was because smaller companies are more sensitive to rising labor costs, which would be negative for wage inflation, a measure closely watched by the Fed:
In the interim, the message is that small cap labor expenses are likely to be far more punitive than wage costs for large businesses. This is confirmed by the sharp rise in the household employment survey relative to the establish- ment survey this year. The former includes smaller companies and the self-employed, and when it rises faster than the payroll survey it is a signal that wage pressures are building among smaller firms. Thus, small cap profit margin pressure will become more acute earlier than it will for large caps.
What`s the real story? How can wage growth be weak and small caps be pressured by wage growth? Is this a case of the technicals (small cap underperformance) telling one story and the fundamentals (wage growth) telling another?
There is always a divergence somewhere
Today, US equities continue to experience negative divergences. As an example, Mark Cook uses a proprietary breadth measurement to gauge the health of the stock market and he is seeing conditions similar to the tops in 2000 and 2007 (emphasis added):
Mark Cook, a veteran investor included in Jack Schwager’s best-selling book, “Stock Market Wizards,” and the winner of the 1992 U.S. Investing Championship with a 563% return, believes the U.S. market is in trouble.The primary indicator that Cook uses is the “Cook Cumulative Tick,” a proprietary measure he created in 1986 that uses the NYSE Tick in conjunction with stock prices. His indicator alerted him to the 1987, 2000, and 2007 crashes. The indicator also helped to identify the beginning of a bull market in the first quarter of April 2009, when the CCT unexpectedly went up, turning Cook into a bull.
What does Cook see now?
“There have been only two instances when the NYSE Tick and stock prices diverged radically, and that was in the first quarter of 2000 and the third quarter of 2007. The third time was April of 2014,” Cook says.
In simple terms, as stock prices have gone higher, the NYSE Tick has moved lower. This divergence is an extremely negative signal, which is why Cook believes the market is losing energy.
In fact, the Tick is showing a bear market, which seems impossible considering how high the market is rising.
“The Tick readings I am seeing (-1100 and -1200) is like an accelerator on the floor that is pressed for an indefinite amount of time,” Cook says. “Eventually the motor will run out of gas. Now, anything that comes out of left field will create a strain on the market.” Since the CCT is a leading indicator, prices have to catch up with the negative Tick readings.
“Think of a dam that has small cracks that are imperceptible to the eye,” he says. “Finally, the dam gives way. Eventually, prices will go south, and the Tick numbers will be horrific.”
Cook is also concerned that the market is acting abnormally. “It’s like being in the Twilight Zone," he says. “Imagine going outside when it’s raining and getting sunburned. That’s the environment we’re in right now.”
The thing is, there is always a divergence. Sometimes they matter, sometimes they don’t. Sometimes one key divergence that was extremely important ends up meaning exactly zero the next time around. A single divergence, in and of itself, has all of the reliable predictive power of a bowl of chicken bones spilled out across the table.And since no one has ever been able to prove otherwise – isolating a single divergence and showing a consistent win rate based on following it – you’re going to have to take my word for it.
What's the fundamental bearish trigger?
So what`s the fundamental trigger this time? The most likely one is a fear of rising interest rates. Perennial bear
My best guess is that current conditions resemble the corrective periods in 2011 and 2012, when we saw a series of recurring oversold signals which culminated in the final pullback that marked those episodes. We just have to figure out what the fundamental trigger for market weakness.
How to subscribe to Trend Model updates
To subscribe to my posts, which include Trend Model updates, click on one of these links on the sidebar or follow me via Twitter @humblestudent:
Disclosure: Cam Hui is a portfolio manager at Qwest Investment Fund Management Ltd. ("Qwest"). This article is prepared by Mr. Hui as an outside business activity. As such, Qwest does not review or approve materials presented herein. The opinions and any recommendations expressed in this blog are those of the author and do not reflect the opinions or recommendations of Qwest.
None of the information or opinions expressed in this blog constitutes a solicitation for the purchase or sale of any security or other instrument. Nothing in this article constitutes investment advice and any recommendations that may be contained herein have not been based upon a consideration of the investment objectives, financial situation or particular needs of any specific recipient. Any purchase or sale activity in any securities or other instrument should be based upon your own analysis and conclusions. Past performance is not indicative of future results. Either Qwest or Mr. Hui may hold or control long or short positions in the securities or instruments mentioned.
Trading in financial instruments and/or cryptocurrencies involves high risks including the risk of losing some, or all, of your investment amount, and may not be suitable for all investors. Prices of cryptocurrencies are extremely volatile and may be affected by external factors such as financial, regulatory or political events. Trading on margin increases the financial risks.
Before deciding to trade in financial instrument or cryptocurrencies you should be fully informed of the risks and costs associated with trading the financial markets, carefully consider your investment objectives, level of experience, and risk appetite, and seek professional advice where needed.
Fusion Media would like to remind you that the data contained in this website is not necessarily real-time nor accurate. The data and prices on the website are not necessarily provided by any market or exchange, but may be provided by market makers, and so prices may not be accurate and may differ from the actual price at any given market, meaning prices are indicative and not appropriate for trading purposes. Fusion Media and any provider of the data contained in this website will not accept liability for any loss or damage as a result of your trading, or your reliance on the information contained within this website.
It is prohibited to use, store, reproduce, display, modify, transmit or distribute the data contained in this website without the explicit prior written permission of Fusion Media and/or the data provider. All intellectual property rights are reserved by the providers and/or the exchange providing the data contained in this website.
Fusion Media may be compensated by the advertisers that appear on the website, based on your interaction with the advertisements or advertisers.