What’s Driving Bitcoin? Factor Analysis Profiles, Part I
James Picerno | Dec 21, 2021 07:29AM ET
What makes Bitcoin tick? There are many theories, ranging from a digital-age store of value to the world’s greatest Ponzi scheme. Narratives are interesting and perhaps useful, but can we quantify Bitcoin’s risk betas with specificity? Let’s give it a try in a series of factor-analysis tests.
The idea of regressing Bitcoin’s price against a set of risk factors comes from a tweet by Fernando Vidal at 3Fourteen Research. Using a classification methodology focused on equity sectors, the modeling shows that financial stocks are the leading suspect to “explain” Bitcoin price changes.
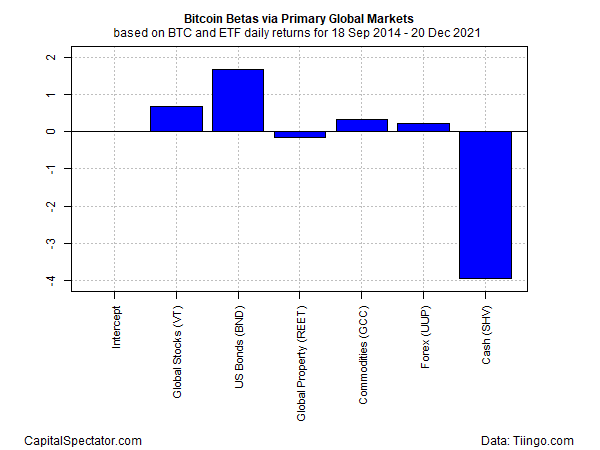
Let’s dig into this a bit deeper by running a series of factor regressions using several sets of economic and markets' indicators. As a starting point, we’ll use a set of ETFs as proxies for the primary market betas:
- Global stocks (VT)
- US Bonds (BND)
- Global real estate (REET)
- Commodities (GCC)
- Forex (UUP)
- Cash (SHV)
There are several caveats, starting with limited data. Bitcoin is a relatively young asset class and so this analysis uses a data set that extends only to 2014. In any case, the main result is that trying to “explain” Bitcoin price volatility through this lens is a poor fit, indicated by the low multiple R-squared: a thin 0.0355. In other words, these six factors explain less than 4% of Bitcoin (BTC) returns, this metric suggests.
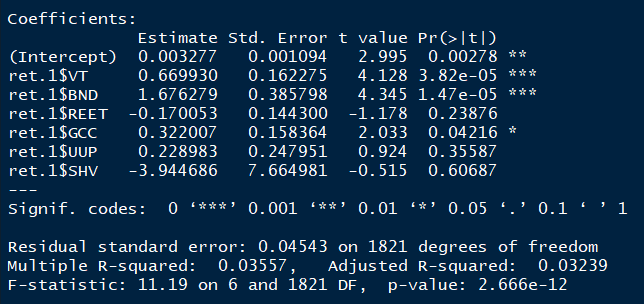
Not encouraging, but what does resonate is that US bonds (BND), followed by global stocks (VT), post the biggest explanatory betas. Note, too, the large negative beta for cash (SHV), which implies that whatever explains BTC, safe-haven liquidity—at least in the traditional sense (i.e., Treasury bills)—isn’t a likely candidate. Meanwhile, commodities (GCC), forex (UUP), and property (REET) are relatively trivial factors.
All which suggests that trying to deconstruct Bitcoin through a standard markets lens from a global top-down perspective is a dead-end. But we’ve only just started to explore our bag of tricks. Chapter 1 is a bust, but the tale of dissecting Bitcoin’s betas has only just begun.
Trading in financial instruments and/or cryptocurrencies involves high risks including the risk of losing some, or all, of your investment amount, and may not be suitable for all investors. Prices of cryptocurrencies are extremely volatile and may be affected by external factors such as financial, regulatory or political events. Trading on margin increases the financial risks.
Before deciding to trade in financial instrument or cryptocurrencies you should be fully informed of the risks and costs associated with trading the financial markets, carefully consider your investment objectives, level of experience, and risk appetite, and seek professional advice where needed.
Fusion Media would like to remind you that the data contained in this website is not necessarily real-time nor accurate. The data and prices on the website are not necessarily provided by any market or exchange, but may be provided by market makers, and so prices may not be accurate and may differ from the actual price at any given market, meaning prices are indicative and not appropriate for trading purposes. Fusion Media and any provider of the data contained in this website will not accept liability for any loss or damage as a result of your trading, or your reliance on the information contained within this website.
It is prohibited to use, store, reproduce, display, modify, transmit or distribute the data contained in this website without the explicit prior written permission of Fusion Media and/or the data provider. All intellectual property rights are reserved by the providers and/or the exchange providing the data contained in this website.
Fusion Media may be compensated by the advertisers that appear on the website, based on your interaction with the advertisements or advertisers.