What To Know About Stock Market Corrections
TD Ameritrade | Sep 16, 2022 04:42AM ET
Stock market corrections happen—it’s a fact of investing life. “Correction” is a term that’s thrown about frequently in the financial media. But what exactly is a market correction? And how can investors spot a correction? What kinds of steps can they take to help them prepare for and attempt to protect against the inevitability of a market correction?
A market correction, as traditionally defined, is a decline of 10% or more from a 52-week high (or other recent peak) in the price of a security or a major benchmark, such as the Dow Jones Industrial Average or the S&P 500 index. Having established that, what else do investors need to know about corrections?
For starters, understand that a market correction serves a few important purposes, according to Sam Stovall, chief investment strategist at CFRA Research. One lesson: Markets don’t go up (or down) forever. Also, investors shouldn’t try to outsmart the markets.
“Corrections are good for the markets, as they reset the dials,” Stovall explained.
“They’re also good for investors as a reminder that they shouldn’t confuse their brains with a bull market.”
While not everyone will agree with those sentiments, they do provide perspective.
Let’s look at a few other basic questions about stock market corrections.
What is a stock market correction?
A correction may result from a reversal of investor optimism and can be triggered by market, economic, or geopolitical factors. Examples include worries over slower earnings growth or a potential recession, or natural or political disruptions such as an assassination, war, or a currency or economic crisis.
“Investors benefit from dividends or price appreciation in stocks,” Stovall said. “But if growth prospects are threatened, that’s when share prices fall. There could be a myriad of unprecedented events that might alter investor optimism.”
How often do market corrections happen?
Historically, corrections have happened roughly every two years, according to Stovall. Since 2010, the S&P 500 has had nine corrections—including two that ultimately reached the 20% bear market threshold—ranging from 10.2% to 35.4%. The most recent correction, a slump of as much as 25.4% that started on January 4, 2022 and has yet to recover, reached the 10% threshold in 20 days and touched a recent low on June 17.
In contrast, smaller market pullbacks have happened on average every nine months or so, while bear markets have come around approximately every five years, and recoveries from these corrections and bear markets can be swift or prolonged. A recent example is the correction of late 2018, which recovered to new highs in just over four months after falling 19.8% and hitting lows of 2346.58 on December 26, 2018 (see figure 1).
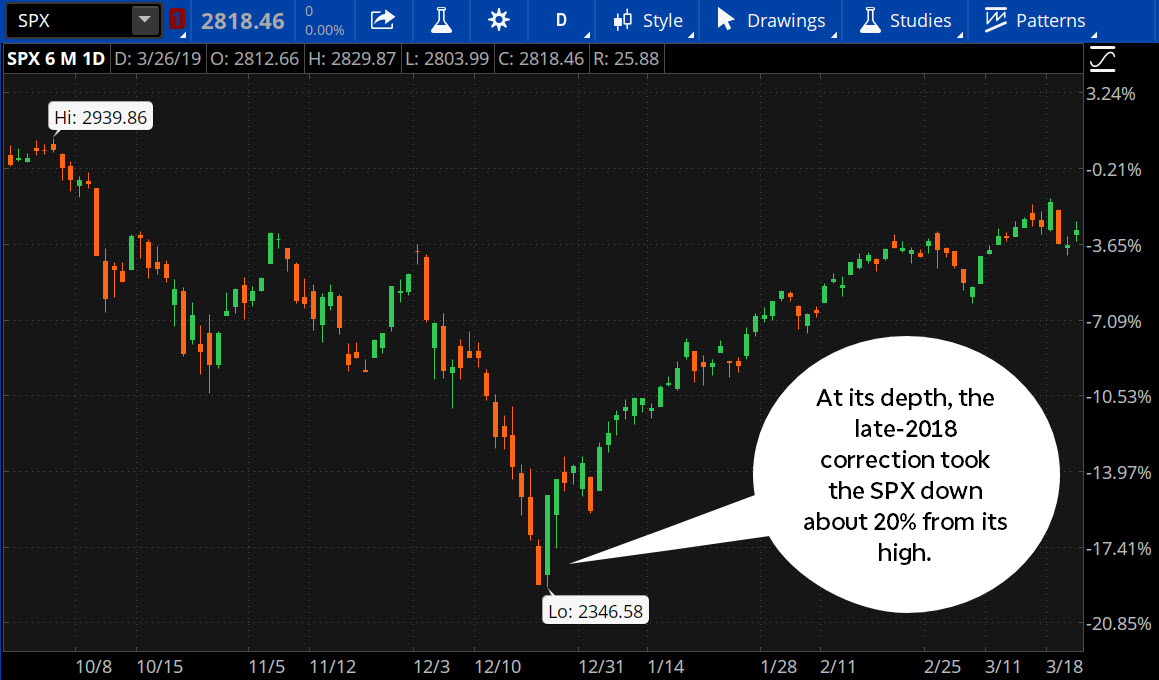
Data source: S&P Dow Jones Indices. Chart source: the platform .
Correction And Recovery
A stock market sell-off in late 2018 took major indexes such as the S&P 500 down about 20% from highs set a few months before. Although the market bounced back within a few weeks, some corrections can take months or even years to recover.
What’s the difference between a correction, a crash, and a bear market?
Definitions of a market correction, crash, and bear market vary slightly, but the distinction mostly hinges around speed. A crash is a “violent and fast correction,” with a market dropping 5% or more in a day or over a few days, according to Jeffrey Hirsch, CEO of Hirsch Holdings and editor of Stock Trader’s Almanac. He cited the May 2010 flash crash and Black Monday of October 1987 as examples.
A crash or correction may or may not take a market below the 20% threshold that defines a bear market. “Every bear market begins as a correction, but not every correction becomes a bear market,” Hirsch said. “Bear markets typically unfold over longer time frames: weeks, months, or years.”
What indicators might signal a stock market correction?
“The 200-day moving average, a widely followed technical gauge, is worth following,” said Kenneth G. Winans, president and chief investment officer at Winans Investments.
This indicator simply averages closing prices over the previous 200 trading days (one calendar year has about 250 trading days), which many market professionals view as a long enough timetable to squeeze out random “noise” and discern a longer-term trend. For example, a closing price below the 200-day moving average could indicate a potential sell signal, while a close above the 200-day moving average could indicate a potential buy signal.
“Studies show that investors who follow this reduced volatility may avoid major drawdowns and increase risk-adjusted returns,” Winans said. Of course, it’s important to check into other research, as not all studies will agree, and even when they might find a theme in common, past events don’t predict future market behavior.
Are corrections happening faster and/or more often?
“Market corrections, and subsequent recoveries, do seem to be occurring with greater frequency and speed over the past two decades,” Stovall noted. This partly reflects the rise of computer-driven trading.
In the 1950 and 1960s, it took an average of 113 days for the S&P 500 to drop from a peak to a 10% decline. In the 1990s and 2000s, the average 10% peak-to-trough took about 60 days, according to the CFRA. And for the nine corrections since 2010, the S&P dropped 10% from 52-week highs in an average of just 35 days.
“As technology has become a more important part of stock trading, the speed at which corrections develop has increased, on average,” Stovall said. “The time from a peak to the 10% decline threshold has essentially been cut in half.”
What can investors do to attempt to prepare for corrections?
For individual investors, part of the battle involves forming a plan. Establish a thoroughly thought-out strategy and a diversified portfolio that fits with your long-term goals and your appetite for risk. Then, stick with your plan.
“Also, think mind over matter,” Stovall said, adding that market corrections are good opportunities for investors to examine their “emotional makeup.”
“Remind yourself that corrections are a natural part of the stock market cycle,” Stovall said.
“Investors can protect themselves by conditioning their mindsets so emotions don’t become their portfolio’s worst enemy, causing them to sell at the bottom.”
3 Tips for Trying to Survive a Market Sell-Off
What should you do when the market goes into correction mode? Much depends on your personal objectives, time horizon, and risk tolerance.
- Ignore the noise. If you’re a long-term investor, the proper course of action might be no action at all.
- Be tactical. Many short-term traders take profits on winning trades and establish firm exit points for losing positions. If you’re hesitant to sell, consider setting up a hedge position.
- Tread lightly. If you’re using a sell-off as a buying opportunity, consider using market information like technical analysis and fundamental data to help you select an entry point.
All investing involves risk, including the possible loss of principal invested. Past performance of a security does not guarantee future results or success.
Disclosure: TD Ameritrade® commentary for educational purposes only. Member SIPC. Options involve risks and are not suitable for all investors. Please read Characteristics and Risks of Standardized Options .
Trading in financial instruments and/or cryptocurrencies involves high risks including the risk of losing some, or all, of your investment amount, and may not be suitable for all investors. Prices of cryptocurrencies are extremely volatile and may be affected by external factors such as financial, regulatory or political events. Trading on margin increases the financial risks.
Before deciding to trade in financial instrument or cryptocurrencies you should be fully informed of the risks and costs associated with trading the financial markets, carefully consider your investment objectives, level of experience, and risk appetite, and seek professional advice where needed.
Fusion Media would like to remind you that the data contained in this website is not necessarily real-time nor accurate. The data and prices on the website are not necessarily provided by any market or exchange, but may be provided by market makers, and so prices may not be accurate and may differ from the actual price at any given market, meaning prices are indicative and not appropriate for trading purposes. Fusion Media and any provider of the data contained in this website will not accept liability for any loss or damage as a result of your trading, or your reliance on the information contained within this website.
It is prohibited to use, store, reproduce, display, modify, transmit or distribute the data contained in this website without the explicit prior written permission of Fusion Media and/or the data provider. All intellectual property rights are reserved by the providers and/or the exchange providing the data contained in this website.
Fusion Media may be compensated by the advertisers that appear on the website, based on your interaction with the advertisements or advertisers.