What makes WisdomTree's Dividend ETFs Different?
ETF Central | Jan 10, 2024 09:14AM ET
The typical approach of most dividend ETFs can indeed seem counterintuitive. These funds often begin by identifying stocks that offer high yields or have a history of growing dividends – characteristics that suggest strong fundamentals.
However, the process often takes a contradictory turn when these stocks are then weighted based on market capitalization. I think the common practice of market-cap weighting may dilute the very essence of a dividend-focused strategy.
If the intention is to isolate stocks based on distinct fundamentals, such as higher yields or consistent dividend growth, it seems counterproductive to then give more emphasis to the largest companies, as one would in a broad market index ETF.
Similarly, an arbitrary equal weighting doesn't always align with the goal of maximizing dividend income or growth. Rather, it seems like a misguided, superficial attempt at diversification.
WisdomTree's approach stands in contrast to these methods. Known for its extensive lineup of dividend-based ETFs, WisdomTree has gained recognition by employing a strategy called "fundamental indexing." In part due to this, the firm recently hit $100 billion in AUM, a noteworthy milestone.
Let's look at how WisdomTree's contrarian approach to indexing has set them apart and what it means for investors seeking exposure to their dividend ETFs.
Fundamental vs market-cap weighted indexing
The widespread use of market-cap-weighted indexing in ETFs is largely due to its practical advantages. This method is cost-effective, straightforward to construct, and easy for ETF providers to license and track.
Additionally, market-cap-weighted indexes involve minimal turnover, contributing to their overall efficiency. The fundamental basis of this approach is simple: a stock’s price multiplied by its outstanding shares should reflect the market’s consensus expectations about that stock.
In contrast, fundamental indexing takes a different approach, moving beyond market capitalization as the sole criteria for stock selection and weighting.
As the name suggests, fundamental indexing focuses on a company's intrinsic financial characteristics, such as earnings, dividends, cash flow, or return on equity. These metrics are considered key indicators of a company's financial health and potential for growth.
The rationale behind fundamental indexing is based on the premise that these financial fundamentals are more indicative of a company's true value than its market capitalization.
Unlike market-cap indexing, which can sometimes overweight overvalued stocks or underweight undervalued ones based purely on market price fluctuations (the recent top-heavy nature of the Nasdaq-100 is a great example of this), fundamental indexing aims to align more closely with a company’s true underlying economic value.
It’s important to note that fundamental indexing is not the same as active management. No fund manager is making discretionary decisions about buying, selling, or rebalancing. Instead, the process remains systematic and rules-based, but the criteria for inclusion and weighting in the index are based on fundamental financial data rather than market cap alone.
In short, the belief underpinning fundamental indexing is that these financial metrics are a better predictor of a company's intrinsic value than its market capitalization.
An example with DGRW
The WisdomTree U.S. Quality Dividend Growth Fund (DGRW) stands as an exemplary case of how effective fundamental indexing can be when executed properly. This ETF follows the WisdomTree U.S. Quality Dividend Growth Index, which employs a distinctive approach to constructing its portfolio:
- Starting Point: It begins with companies from the WisdomTree U.S. Dividend Index, specifically focusing on those with a market capitalization of $2 billion or more.
- Company Selection: Out of this group, the index picks the top 300 companies. For growth, the index looks at long-term earnings growth expectations. For quality, it examines their three-year historical average return on equity and return on assets.
- Weighting Scheme: Finally, the index weights constituents based on the dividends it's expected to pay in the upcoming year, calculated using the latest declared dividend.
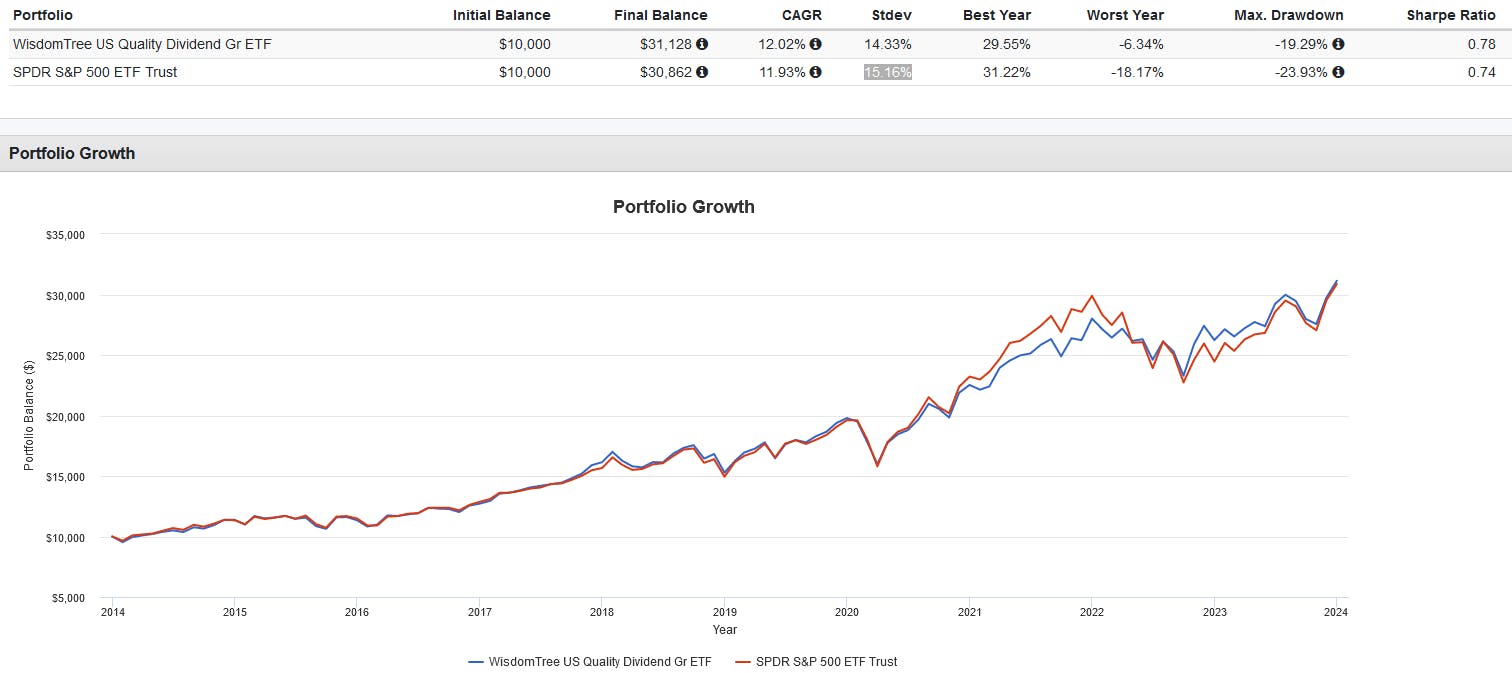
Despite a relatively higher expense ratio of 0.28%, DGRW has shown impressive performance. From 2014 to December 31, 2023, DGRW managed to outperform the SPDR S&P 500 ETF (SPY (NYSE:SPY)), delivering an annualized return of 12.02% compared to SPY's 11.93%.
Furthermore, DGRW exhibited a standard deviation of 14.33% versus SPY's 15.16%, indicating lower volatility. The overall risk-adjusted returns were also superior for DGRW at 0.78, compared to SPY's 0.74.
A factor regression analysis of DGRW also reveals statistically significant loadings to both the profitability (RmW) and investment (CmA) factors.
This is an important aspect for investors as it suggests that DGRW's performance can be partially attributed to its exposure to profitable companies which invest conservatively.
These loadings indicate that DGRW is not just a dividend growth play but is also effectively capturing elements of quality and growth in its selection process, validating the fundamental indexing approach used in its construction.
This content was originally published by our partners at ETF Central .
Trading in financial instruments and/or cryptocurrencies involves high risks including the risk of losing some, or all, of your investment amount, and may not be suitable for all investors. Prices of cryptocurrencies are extremely volatile and may be affected by external factors such as financial, regulatory or political events. Trading on margin increases the financial risks.
Before deciding to trade in financial instrument or cryptocurrencies you should be fully informed of the risks and costs associated with trading the financial markets, carefully consider your investment objectives, level of experience, and risk appetite, and seek professional advice where needed.
Fusion Media would like to remind you that the data contained in this website is not necessarily real-time nor accurate. The data and prices on the website are not necessarily provided by any market or exchange, but may be provided by market makers, and so prices may not be accurate and may differ from the actual price at any given market, meaning prices are indicative and not appropriate for trading purposes. Fusion Media and any provider of the data contained in this website will not accept liability for any loss or damage as a result of your trading, or your reliance on the information contained within this website.
It is prohibited to use, store, reproduce, display, modify, transmit or distribute the data contained in this website without the explicit prior written permission of Fusion Media and/or the data provider. All intellectual property rights are reserved by the providers and/or the exchange providing the data contained in this website.
Fusion Media may be compensated by the advertisers that appear on the website, based on your interaction with the advertisements or advertisers.