What Key November Reversals Mean For Commodities Going Into 2021
Andy Hecht | Dec 07, 2020 06:04AM ET
This article was written exclusively for Investing.com.
- A key reversal pattern on the monthly chart can be a powerful technical force
- Bullish and bearish reversals in the precious metals
- Bullish patterns in the two benchmark crude oil futures markets
- Soft commodities: positive price action in coffee and cocoa
- The dollar reverses lower, a critical factor for commodities
We are now in the final month of 2020. It's been an extraordinarily tumultuous year, one that will go down in history as a period many would like to forget.
The worst global pandemic since the 1918 Spanish flu continues to claim victims even though vaccines that could create herd immunity are on the horizon for 2021. The US election results will change the leader of the free world on Jan. 20 as President Trump will depart his unlikely term, and President-elect Joseph Biden will take over in the Oval Office.
Markets across all asset classes have been highly volatile this year. A brutal selloff caused by the coronavirus’s spread in March sent the leading stock market indices to lows at that time.
Since then, a massive recovery has been in effect. Indeed, November was a banner month for equities with many making new record highs led by the NASDAQ, which gained almost 84% over the past eight months. For stocks, the momentum has continued with the DJIA recently reaching a new milestone at the 30,000 level.
Commodity markets have also experienced more than their share of price variance. In April, the price of nearby NYMEX crude oil fell below zero for the first time. Crude oil has made higher lows and higher highs since reaching over negative $40 per barrel on a fateful day in late April.
Silver fell to its lowest price since 2009 and then rose to the highest level since 2013. Gold rose to new record highs in all currencies earlier this year before correcting since August. And copper traded below $2.06, the lowest price since June 2016, before rallying to its highest level since 2013 at over $3.40 per pound.
Wheat rose to a six-year high. Soybeans also reached a multi-year peak.
On Nov. 30, five commodity markets put in technical reversals on their monthly charts. Two bearish reversals and three bullish ones could lead to more price variance over the coming weeks as we head toward 2021; hopefully, a far better year for the world.
A key reversal pattern on the monthly chart can be a powerful technical force
A bullish key reversal trading pattern occurs when an asset’s price falls below the previous period’s low and closed above its’ high. A bearish reversal is the opposite, as a market makes a higher high than the prior period and then closes below its low.
Reversals reflect a shift in the path of least resistance of a price. On longer-term charts, trend-following traders and systems often buy on a bullish reversal and sell on a bearish one.
We are now in the final month of the year that most of us will be happy to see behind us on New Year’s Eve. Before that, however, note that November was a busy period for commodities markets as assets across all categories—energy, metals and ags—put in reversals on their monthly charts.
Bullish and bearish reversals in the precious metals
Gold had a rough November. After rallying above October’s high, the yellow metal’s price dropped steadily and closed last month below the previous month’s low.
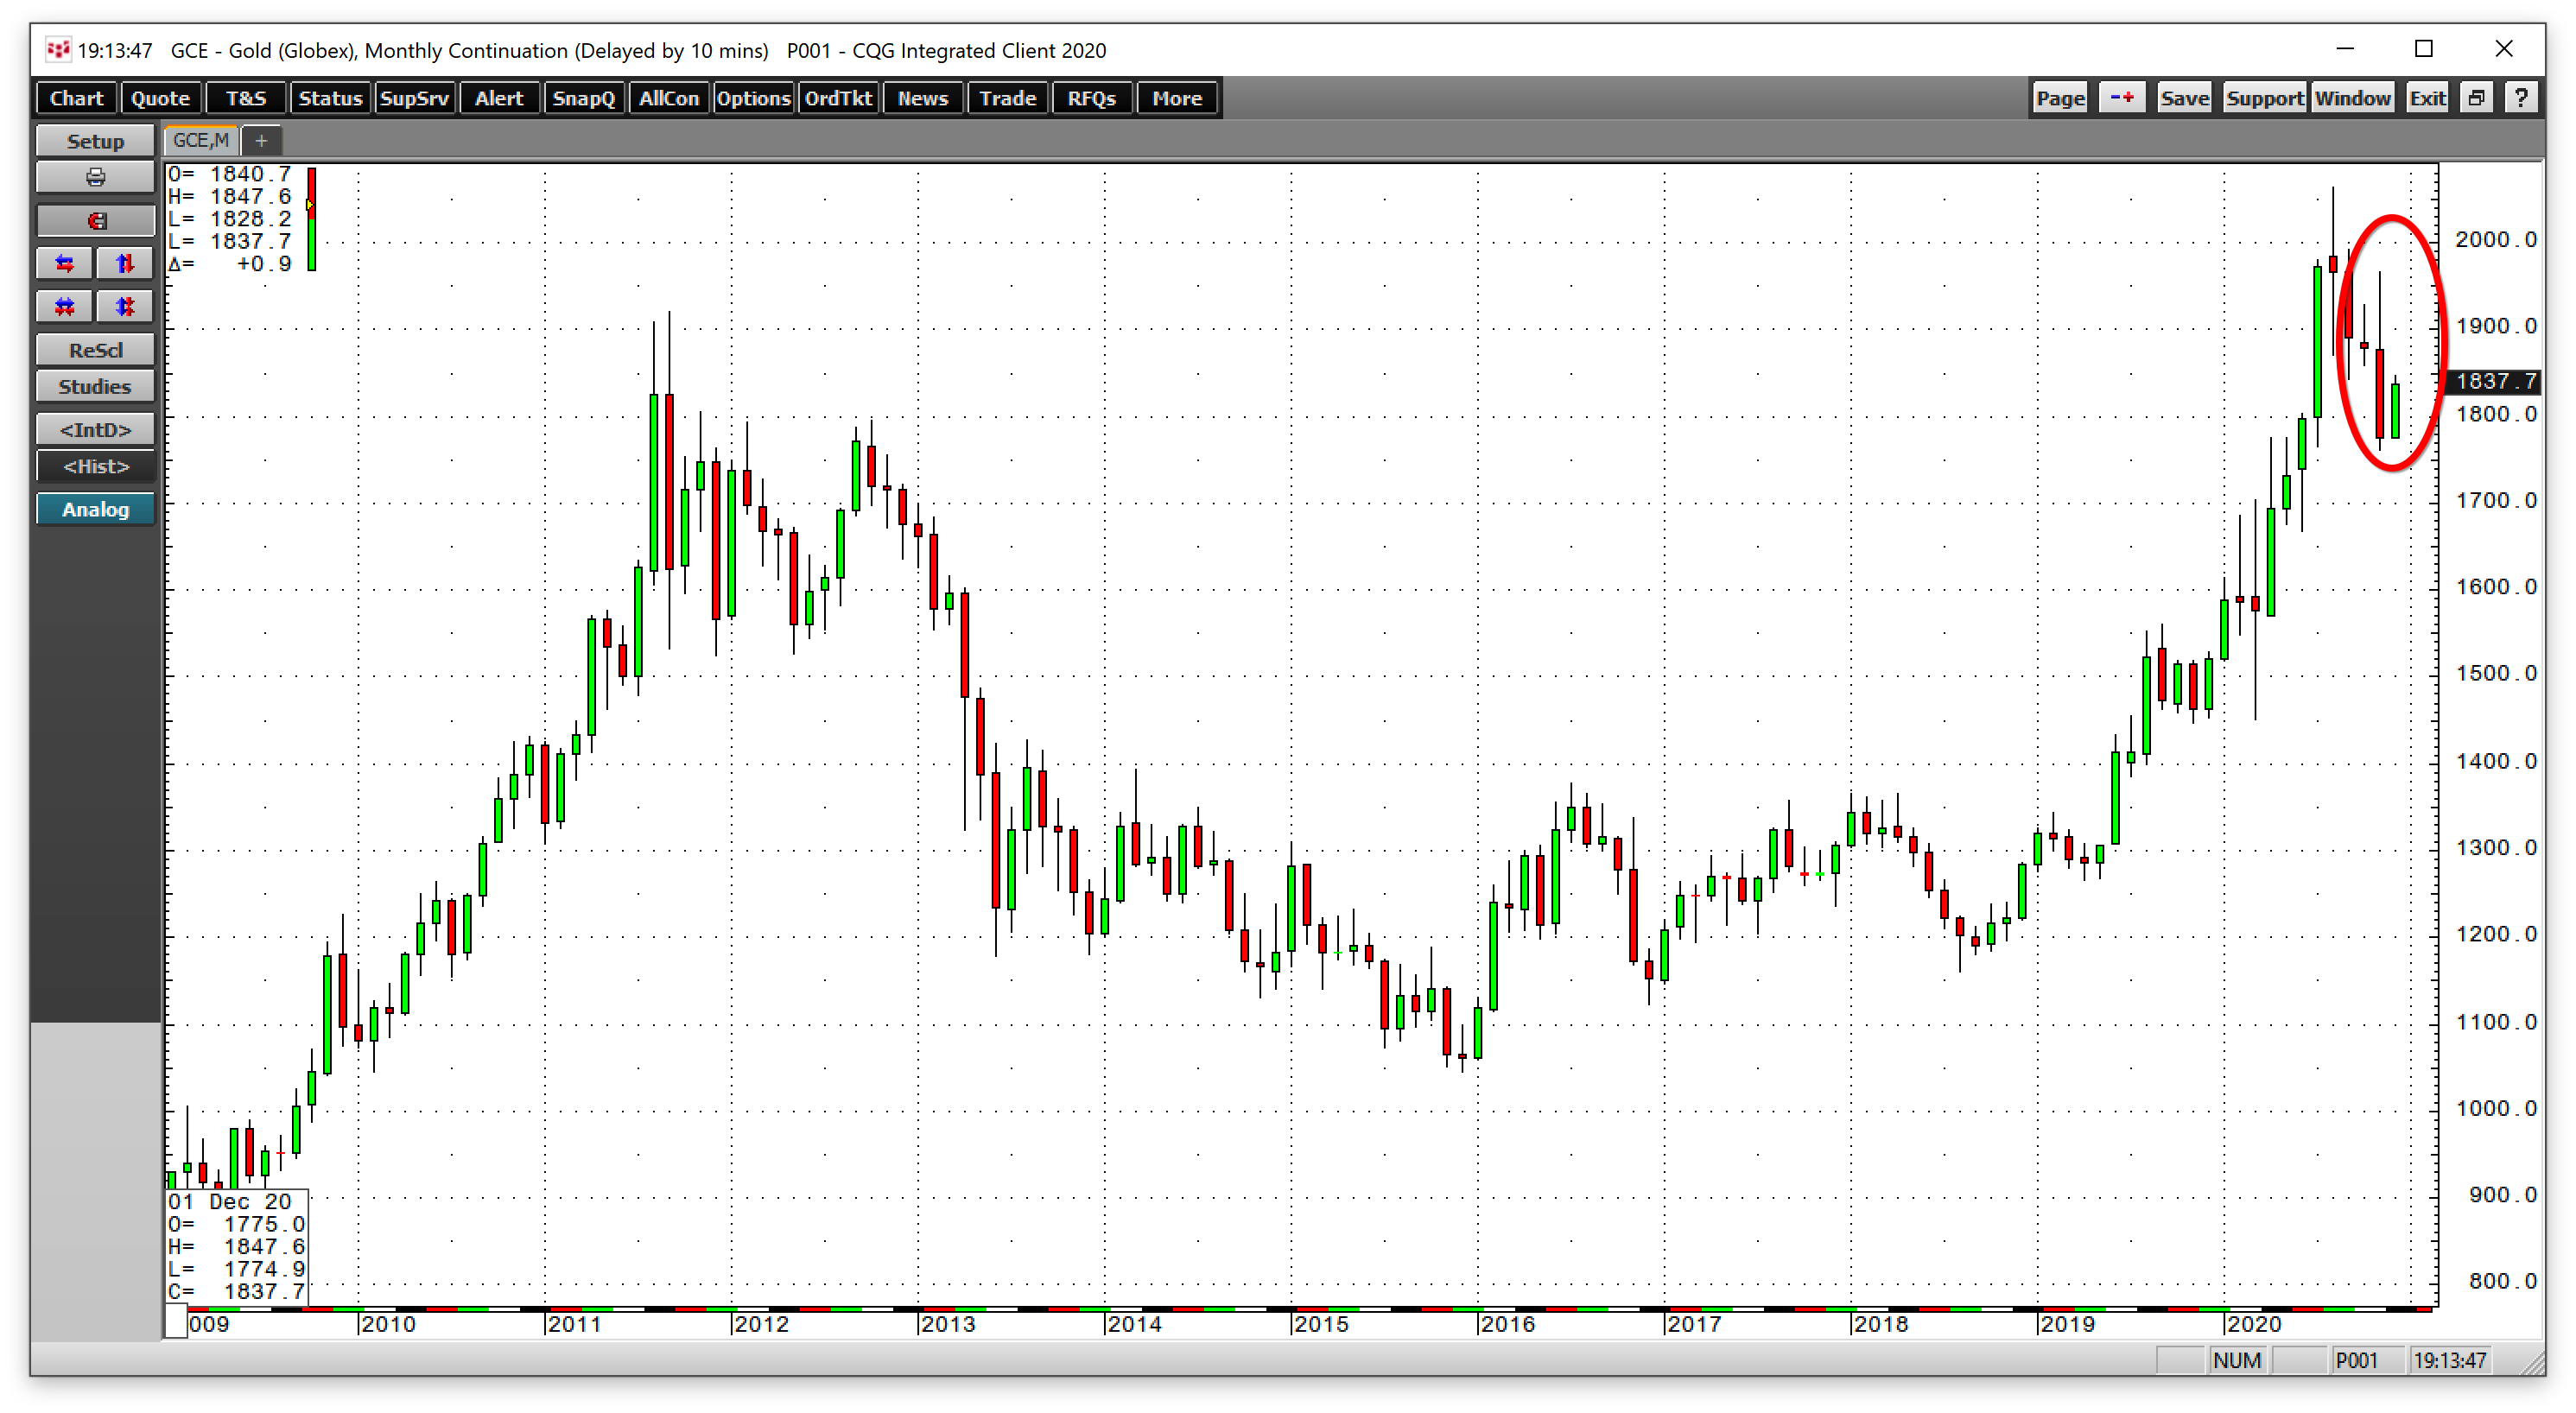
Source, all charts: CQG
Nearby COMEX gold futures reached a low of $1859.20 in October and settled at $1775.70 on Nov. 30, $83.50 below the level that established the bearish technical reversal pattern.
While gold’s reversal was by a wide margin, silver's was narrow.
The chart illustrates that silver made a higher high in November than October and then settled only 9.10 cents below the October low on Nov. 30. Both gold and silver put in bearish technical patterns on the long-term chart last month, but another precious metal went in the opposite direction.
Platinum fell to a marginally lower low last month compared to October. The precious metal's price fell only $5.30 below the October low before settling $47.40 above the October high, as platinum put in a bullish key reversal trading pattern on the monthly chart.
Gold and silver markets limped into December with a technical sell signal, while platinum futures were flashing a sign that the path of least resistance is higher.
Bullish patterns in the two benchmark crude oil futures markets
WTI and Brent crude oil futures are the pricing benchmarks for the energy commodity worldwide. Approximately two-thirds of oil producers and consumers price their petroleum from the Brent benchmark, which trades in the futures market on the Intercontinental Exchange. Brent is the benchmark for oil from Europe, Africa, and the Middle East.
Source: Barchart
The monthly chart shows that Brent fell below the October low of $36.68 when it traded to $35.73 in November. The nearby oil contract then rallied above October’s peak at $43.60 to close November at $47.88 per barrel. Brent crude oil put in a bullish key reversal pattern on the monthly chart.
The chart above shows that NYMEX WTI crude oil futures, the benchmark pricing mechanism for the United States, the world’s leading producer of the energy commodity, put in the same bullish pattern on its monthly chart. The price dropped $1.28 below the October low and rose $3.64 above the October peak at $41.70 per barrel. January futures settled at $45.34 on Nov. 30.
The crude oil market moved into December on a bullish note. On the final day of last month, the international oil cartel met to discuss a continuation of the 7.7 million barrel per day production cut for the coming months. OPEC could not reach an agreement on Nov. 30, but that did not stop the price of oil from putting in the bullish reversal patterns.
Soft commodities: positive price action in cocoa and coffee
Two of the volatile soft commodities posted bullish reversals on their monthly charts in November.
The monthly cocoa chart shows that the price dropped $43 per ton below October’s low in November and closed on Nov. 30, $481 above the prior month’s high at $3008 on the nearby ICE contract. The cocoa price was weak over the Halloween holiday because of social distancing, pushing the price lower.
In November, global confectionery giant Hershey's (NYSE:HSY) substantial purchase in the futures market sent cocoa to a new high for 2020, the highest price since August 2016. The chocolate manufacturer avoided surcharges from the Ivory Coast and Ghana by purchasing cocoa beans on the futures exchange.
ICE coffee futures fell to a marginal new low in November, 0.80 cents below the October low before closing on Nov. 30, 6.85 cents above the October peak. Coffee futures have been making higher lows since April 2019.
The dollar reverses lower, a critical factor for commodities
The US dollar is the world’s reserve currency and the benchmark pricing tool for most commodities. A rising dollar tends to weigh on raw material prices, while a falling greenback often supports rising prices. In November, the Dollar Index experienced a bearish reversal on the monthly chart.
The monthly chart shows that after moving marginally higher than the October peak, the index closed November below the previous month’s low. The dollar has been making lower lows since March 2020. Last month’s bearish key reversal could push the index towards a challenge of its next support level at the February 2018, 88.15 low.
At the end of last week, the settlement prices were at the following levels after the monthly reversals:
- Gold: $1840 as gold rallied and did not follow through
- Silver: $24.253 as silver rallied and did not follow through
- Platinum: $1072.80 as platinum followed-through
- NYMEX Crude Oil: $46.26 as crude oil followed-through
- Brent Crude Oil: $49.25 as crude oil followed-through
- Cocoa: $2654 as cocoa did not follow through
- Coffee: $1.1755 as coffee did not follow through
- Dollar index: 90.694 as the dollar index followed-through
Time will tell if the technical patterns cause follow-through buying or selling. Volatility in the commodities asset class is likely to remain the norm rather than the exception into 2021 and beyond given the coronavirus’s lasting impact on the global economy.
As well, the falling dollar could be the most influential factor for commodities.
Trading in financial instruments and/or cryptocurrencies involves high risks including the risk of losing some, or all, of your investment amount, and may not be suitable for all investors. Prices of cryptocurrencies are extremely volatile and may be affected by external factors such as financial, regulatory or political events. Trading on margin increases the financial risks.
Before deciding to trade in financial instrument or cryptocurrencies you should be fully informed of the risks and costs associated with trading the financial markets, carefully consider your investment objectives, level of experience, and risk appetite, and seek professional advice where needed.
Fusion Media would like to remind you that the data contained in this website is not necessarily real-time nor accurate. The data and prices on the website are not necessarily provided by any market or exchange, but may be provided by market makers, and so prices may not be accurate and may differ from the actual price at any given market, meaning prices are indicative and not appropriate for trading purposes. Fusion Media and any provider of the data contained in this website will not accept liability for any loss or damage as a result of your trading, or your reliance on the information contained within this website.
It is prohibited to use, store, reproduce, display, modify, transmit or distribute the data contained in this website without the explicit prior written permission of Fusion Media and/or the data provider. All intellectual property rights are reserved by the providers and/or the exchange providing the data contained in this website.
Fusion Media may be compensated by the advertisers that appear on the website, based on your interaction with the advertisements or advertisers.