8 Lessons From The Charts Of Economically Sensitive ETFs
Chris Ciovacco | Apr 05, 2016 06:22AM ET
We can learn a lot from the chart below, which shows the performance of economically-sensitive stocks relative to the S&P 500. After the S&P 500 bottomed on February 11, cyclicals (Consumer Discretionary Select Sector SPDR (NYSE:XLY)) took the lead off the low as economic confidence started to improve. Notice the steep slope of the ratio off the recent low (see green text). The confident look has morphed into a more concerning look as the S&P 500 (via SPDR S&P 500 (NYSE:SPY)) has continued to rise over the last month (orange text), which tells us to keep an open mind about a pullback in the stock market.

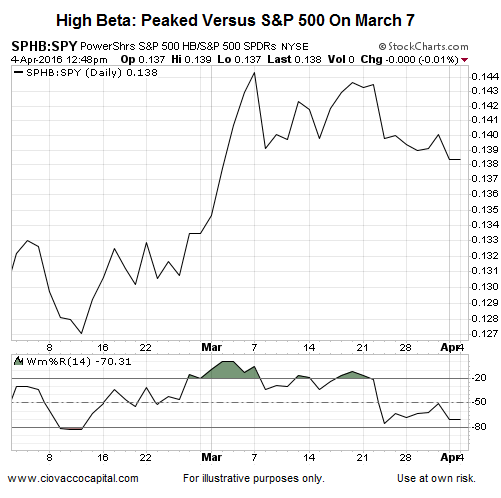
A similar picture emerges when we examine the high beta stocks (Powershares S&P 500 High Beta Portfolio (NYSE:SPHB)) to S&P 500 ratio below.
What Can We Learn From The Longer-Term View?
This week’s stock market video examines the question:
What can we learn from asset class behavior?
The video covers low beta stocks (Powershares S&P 500 Low Volatility Portfolio (NYSE:SPLV)), consumer staples (Consumer Staples Select Sector SPDR (NYSE:XLP)), Treasuries (iShares 20+ Year Treasury Bond (NYSE:TLT)), high-yield bonds (SPDR Barclays (LON:BARC) High Yield Bond (NYSE:JNK)), the NASDAQ (PowerShares QQQ Trust Series 1 (NASDAQ:QQQ)), Dow (SPDR Dow Jones Industrial Average (NYSE:DIA)), NYSE Composite Stock Index (Vanguard Total Stock Market (NYSE:VTI)), VIX (iPath S&P 500 VIX Short-Term Futures Exp 30 Jan 2019 (NYSE:VXX)), crude oil (US Oil Fund (NYSE:USO)), emerging markets (iShares MSCI Emerging Markets (NYSE:EEM)), transportation (iShares Transportation Average (NYSE:IYT)), energy (Energy Select Sector SPDR (NYSE:XLE) ), and materials (iShares US Basic Materials (NYSE:IYM)).

Back To The Shorter-Term Charts
The economically-sensitive materials sector (Materials Select Sector SPDR (NYSE:XLB)) has significantly lagged the S&P 500 over the past two weeks.
Given the consumer is often referred to as the lifeblood of the U.S. economy, the tepid relative performance of the SPDR S&P Retail ETF (NYSE:XRT) since March 8 is a bit concerning.
If problems return to the oil patch, problems may return in the credit markets. Oil peaked relative to the S&P 500 over 2 weeks ago.
Transportation stocks have made little to no progress relative to the broader stock market since early March.
Brazil (iShares MSCI Brazil Capped (NYSE:EWZ)) has been one of the best performing ETFs since late January 2016. As shown in the EWZ/SPY chart below, the ratio has stalled in recent weeks.
If credit leads stocks, then the chart below tells us confidence in the current stock market rally may be waning.
Trading in financial instruments and/or cryptocurrencies involves high risks including the risk of losing some, or all, of your investment amount, and may not be suitable for all investors. Prices of cryptocurrencies are extremely volatile and may be affected by external factors such as financial, regulatory or political events. Trading on margin increases the financial risks.
Before deciding to trade in financial instrument or cryptocurrencies you should be fully informed of the risks and costs associated with trading the financial markets, carefully consider your investment objectives, level of experience, and risk appetite, and seek professional advice where needed.
Fusion Media would like to remind you that the data contained in this website is not necessarily real-time nor accurate. The data and prices on the website are not necessarily provided by any market or exchange, but may be provided by market makers, and so prices may not be accurate and may differ from the actual price at any given market, meaning prices are indicative and not appropriate for trading purposes. Fusion Media and any provider of the data contained in this website will not accept liability for any loss or damage as a result of your trading, or your reliance on the information contained within this website.
It is prohibited to use, store, reproduce, display, modify, transmit or distribute the data contained in this website without the explicit prior written permission of Fusion Media and/or the data provider. All intellectual property rights are reserved by the providers and/or the exchange providing the data contained in this website.
Fusion Media may be compensated by the advertisers that appear on the website, based on your interaction with the advertisements or advertisers.