Week Ahead: Will Soft Economic Data Confirm Commodity Weakness?
Jeff Miller | Aug 02, 2015 02:06AM ET
Recent weeks have emphasized markets (especially declining commodity prices) as a read on the economy. This week’s full slate of data will provide a reality check on that interpretation. The punditry will be asking:
Will July economic data confirm the weakness signaled by commodities?
Prior Theme Recap
In my last WTWA I predicted that discussion would focus on the “message of the markets.” This was a good call, with many stories featuring this theme. Interpretation was challenging because of the early-week swings. As he does each week, Doug Short’s recap explains the story and his great weekly snapshot lets you see it at a glance. With the ever-increasing effects from foreign markets, you might add Doug’s World Markets Weekend Update to your reading list.
We would all like to know the direction of the market in advance. Good luck with that! Second best is planning what to look for and how to react. That is the purpose of considering possible themes for the week ahead. You can try it at home.
This Week’s Theme
This week is the flip side of last week’s emphasis on market signals, especially commodity prices. The big earnings message has been registered, along with the huge July plunge in commodities and energy stocks. The crowded calendar for economic data releases provides the first insight into July results. Observers will be asking:
Will July economic data confirm the message of economic weakness?
…and for some… Will the Fed react?
The Viewpoints
The conclusions about the economy cover a wide range.
- The market message warns of deflation and recession. Brad Zigler highlights some “ominous indicators.” He looks at a “daily inflation index” and also gold versus oil.
- Economic fundamentals remain weak, concludes Steven Hansen in his survey article discussing the GEI economic forecasts. Dr. Ed also sees an economy that is “getting soft again.”
- There is no contagion from energy credit spreads or China. Scott Grannis analyzes the data.
- Economic growth maintains a solid, if modest, uptrend. Atlanta Fed’s GDPNow calculator – right on target. The key point is the superiority of methods like this over those used by those on a mission – “Doomers” in his parlance – who seek out an indicator to prove a point.
- Indicators remains solid except for industrial production, notes Menzie Chinn in his careful look at both US and global data. He distinguishes between slowdowns and actual reductions in output.
- Continued employment gains could encourage the Fed to move in September. Top Fed watcher Tim Duy parses this week’s statement and suggests what to watch for in the data.
As always, I have my own ideas in today’s conclusion. But first, let us do our regular update of the last week’s news and data. Readers, especially those new to this series, will benefit from reading the background information .
Personal Note
I am going on vacation beginning next weekend so there will be no WTWA. If something really interesting happens, I might post a brief comment. Posting on the following weekend is also uncertain. I often get emails from readers when I miss a week or two, and I appreciate the concern. I am sure that everyone knows I need some time off. So far, I have not figured out a good alternative, but I am considering some pinch-hitters.
Last Week’s Data
Each week I break down events into good and bad. Often there is “ugly” and on rare occasion something really good. My working definition of “good” has two components:
- The news is market-friendly. Our personal policy preferences are not relevant for this test. And especially – no politics.
- It is better than expectations.
The Good
There was some good economic news.
- The Greek agreement is still in place – at least for now. The IMF says “no more” without a better reform commitment, but reports of meetings remained positive.
- Earnings reports have been good. There are many ways to spin the season – lowered expectations, exceptional factors in energy, the effect of Apple (NASDAQ:AAPL), and easy comparisons for certain bank stocks. Cutting through all of the confusion and getting to the heart of the matter is earnings expert Brian Gilmartin. His WSJ shows the improvement by sector.
- Earnings stock reaction has been positive. Bespoke has the story and this chart.
- Durable goods orders beat expectations.
- Chicago PMI was strong at 54.7 versus 50.5 expected. As I recently noted, this is one of the indicators that actually has a good predictive record, so we’ll take note of the good news .
- Sentiment is negative. As a contrarian indicator, this is bullish for stocks. Horan Capital Advisors reports on the AAII indicator.
The Bad
There was also some negative data last week.
- Consumer confidence disappointed. The Conference Board version seriously missed expectations (90.9 versus 99.3) and the Michigan version was also weak. These surveys correlate nicely with employment and spending. Doug Short has the full story and also the best charts. If I were still teaching my course in data presentation, I would use this as an example of telling a complex story in an uncluttered fashion. I often cite the Michigan version, but today we’ll look at the Conference Board series.
- The House adjourned for five weeks. Some humorists would call this “good news” but there was actually a lot left undone. (See The Hill ).
- Pending home sales disappointed. (See Calculated Risk ).
- Q2 GDP was slightly lower than estimates, although Q1 was shifted into plus territory. Q2 was 2.3% growth versus only 0.6% in Q1. The overall pace remains well below trend and potential.
- The employment cost index showed only a small increase. Diane Swonk, in , explains the dual edge if this indicator. The Fed wants economic growth and expects an increase to a modest rate of inflation. Wage growth is needed. This said, too much inflation would be bad.
The Beautiful
Despite continuing worldwide violence, let’s take a break from “the ugly.” Occasionally it is helpful to look on the bright side, and we have such news this week. The Ebola story has been a frequent theme in our “ugly” section, so I am delighted to take note of the recent successful vaccine trials – flu vaccine .
Our go-to biotech expert, John McCamant publishes the Medical Technology Stock Letter . I appreciate his willingness to help interpret this story. I love his explanation of events – emphasizing the speed with which companies can now create vaccines and separating the profit implications from the saving of lives.
The Silver Bullet
I occasionally give the Silver Bullet award to someone who takes up an unpopular or thankless cause, doing the real work to demonstrate the facts. Think of The Lone Ranger.
This week’s award goes to Michael Batnick for his analysis of .
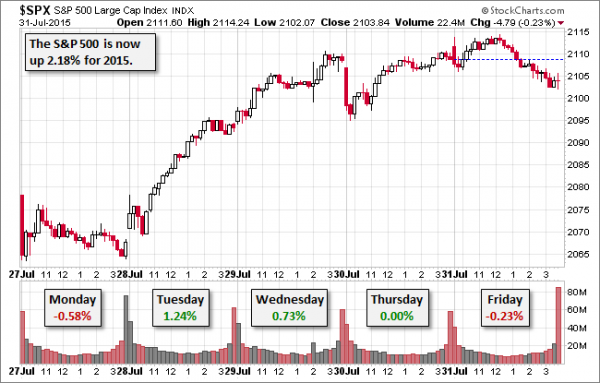
Conventional wisdom goes that prior to market tops, the major averages become more reliant on just a handful of stocks to lead the rally. When stocks are making new highs, it’s important to look at breadth indicators because indices can pull a nasty trick of masking what is actually happening to the majority of stocks. For instance, the S&P 500 is up 2.3% YTD, however, the average S&P 500 stock is down 0.7%.
Observers with a mission fail to note that divergences often resolve to the upside. Here is an interesting table, showing both frequency and the range of gains.
Quant Corner
Whether a trader or an investor, you need to understand risk. I monitor many quantitative reports and highlight the best methods in this weekly update. For more information on each source, check here .
Recent Expert Commentary on Recession Odds and Market Trends
Bob Dieli does a monthly update (subscription required) after the employment report and also a monthly overview analysis. He follows many concurrent indicators to supplement our featured “C Score.”
RecessionAlert : A variety of strong quantitative indicators for both economic and market analysis. While we feature the recession analysis, Dwaine also has a number of interesting systems. These include approaches helpful in both economic and market timing. He has been very accurate in helping people to stay on the right side of the market.
combination of models to do gradual shifting to and from the S&P 500.
finally admitted to the error in their forecast, but still claims the best overall record. This is simply not true. I rejected their approach in real time during 2011 and also highlighted competing methods that were stronger. Until we know what is inside the black box (I suspect excessive reliance on commodity prices and insistence on unrevised data) we will be unable to evaluate their approach. Doug is more sympathetic in his last update. While I disagree, it will require a longer post to elaborate.
ECRI now thinks that a near-term recession is unlikely, and Doug has the story .
The St. Louis Fed has some interesting ideas about one of our regular themes – . How about using the electricity/GDP ratio?
Dan Strumpf of the WSJ notes that more investors are going short, the highest level in 2 ½ years. He notes that opinions vary on whether this is “smart money” or a contrarian indicator. (My guess? Like so many such charts it is a coincident indicator of herd behavior).
The Week Ahead
It is another big week for economic data.
The “A List” includes the following:
- Employment situation report (Friday). The most widely followed indicator.
- PCE Prices (Monday ). The Fed’s favorite inflation measure edges closer to the target.
- ISM Index. Good concurrent read on the economy with some leading elements.
- Auto sales. Important economic read using private-sector data.
- ADP private employment (Wednesday ). Alternative method to that of the BLS deserves more attention.
- Initial jobless claims (Thursday). The best concurrent news on employment trends, with emphasis on job losses.
- Personal income and spending. June data, but especially important with business investment low.
The “B List” includes the following:
- ISM services. Less history than the manufacturing index, but covers more of the economy.
- Factory orders (Tuesday). June data. A rebound in this series?
- Trade balance. June data relevant to Q2 GDP final estimate.
- Crude oil inventories . Current interest in energy keeps this on the list of items to watch.
Earnings season continues, although the biggest names have already reported.
How to Use the Weekly Data Updates
In the WTWA series I try to share what I am thinking as I prepare for the coming week. I write each post as if I were speaking directly to one of my clients. Each client is different, so I have five different programs ranging from very conservative bond ladders to very aggressive trading programs. It is not a “one size fits all” approach.
To get the maximum benefit from my updates you need to have a self-assessment of your objectives. Are you most interested in preserving wealth? Or like most of us, do you still need to create wealth? How much risk is right for your temperament and circumstances?
My weekly insights often suggest a different course of action depending upon your objectives and time frames. They also accurately describe what I am doing in the programs I manage.
Insight for Traders
Felix has switched back to neutral after several weeks leaning bullish. The confidence in this three-week forecast remains very low with the continuing extremely high percentage of sectors in the penalty box. Felix has remained fully invested, including some foreign exposure, because there are still several attractive sectors. The inverse funds recently moved up the rankings, but never hit the top three, the point where we would trade them. For more information, I have posted a further description — here ).
The trading range held. Charles Kirk’s weekly chart show is must-reading for any trader (small subscription fee required). Charles does his usual job of describing setups to watch. He also notes that the market held the trading range despite “everything thrown at it.”
Brett Steenbarger has some advice about a current trader frustration: choppy markets. You may need to adjust your methods to current conditions.
Insight for Investors
I review the themes here each week and refresh when needed. For investors, as we would expect, the key ideas may stay on the list longer than the updates for traders. Major market declines occur after business cycle peaks, sparked by severely declining earnings. Our methods are focused on limiting this risk. Start with our Tips for Individual Investors and follow the links.
We also have a page summarizing many of the current investor fears . If you read something scary, this is a good place to do some fact checking.
In part two of my series on risk I used the Chinese market as an example of headline risk. My main objective is to explain how to navigate the ever-threatening headlines. Along the way I share a few ideas of how you might profit from stocks with Chinese exposure.
Other Advice
Here is our collection of great investor advice for this week.
If I had to pick a single most important article, it would be this perspective from Barry Ritholtz, who warns to de-emphasize the Fed. Normalization of rates will not be a disaster – it is desirable. Investors should learn that a data-dependent increase is just fine. He explains the Fed’s dual mandate and the current status of both employment and inflation.
The message should not be news for regular readers of WTWA, but Barry says it well. I will add that market and business cycles usually continue up for about two years from the first rate hike.
Stock Ideas
Amazon Amazon) or Wal-Mart? This interesting article uses the two leading retailers to analyze very different investment styles. The two companies have roughly equal market caps. Using some friendly assumptions for Amazon (NASDAQ:AMZN), the author concludes that it will still take 10 years for the online giant to surpass Wal-Mart (NYSE:WMT) in earnings. Wal-Mart sales are five times Amazon’s.
Personal Finance
Professional investors and traders have been making Abnormal Returns a daily stop for over ten years. The average investor should make time (even if not able to read every day as I do) for a weekly trip on Wednesday. Tadas always has first-rate links for investors in this simple list of key points on how to invest – and how not to! The latter list included keeping a time horizon of five years or so and being careful about annuity investments.
And beware of “information overload.” Jeff Reeves explains how to get past the avalanche of meaningless comparisons.
And importantly, do not obsess over short-term losses. (Investor Junkie ). This article has good advice on two of our regular themes:
- Focusing on company fundamentals instead of the stock price
- Starting by right-sizing your risk.
High-Yield Bonds
Last week I noted the warning from Jeff Gundlach and Carl Icahn via Garth Friesen , who analyzes apparent inconsistencies in the Icahn argument. Personally, I feel that if you are going to take high-yield risk, you would do better to own stocks. Some readers ask why I quote viewpoints where I do not agree. I hope that most understand that I try to present a balanced picture. I make suggestions and reveal what I am doing, but try to separate that from the market reporting and links.
Market Outlook
Jeremy Grantham of GMO does not like the long-term prospects for stocks, but thinks that herd mentality will keep things safe until after the election. Justin Kermond reports at Advisor Perspectives.
Energy Stocks
Many MLPs are doing worse than oil stocks, not catching the moves when prices rebound. Amey Stone (Barron’s ) explains. The key? A correlation with high-yield bonds.
Final Thought
Last week once again illustrated a trading opportunity within the recent range.
Unlike traders cannot make effective major shifts in short time periods. Most who try to be agile wind up losing money through the market timing attempts.
The week ahead mirrors the theme from last week, but now the emphasis will be upon economic data. In the first half of the year we have experienced softness in many of the key indicators while avoiding a serious recession threat. The market seems to expect this to continue.
I am especially interested in the employment numbers – all of the measures, not just the BLS version. Sales of pickup trucks are a good secondary measure, as is the ISM index.
Unless there is a dramatic reduction in the pace of growth, the discrepancy between commodity prices and economic data will continue. The economic data are far more positive than the apparent message of the market. A strong approach to investing is to make your investment choices on fundamental grounds and take advantage of errors by “Mr. Market.” A strong economy will benefit corporate earnings even if it encourages the Fed to start a tightening cycle.
Trading in financial instruments and/or cryptocurrencies involves high risks including the risk of losing some, or all, of your investment amount, and may not be suitable for all investors. Prices of cryptocurrencies are extremely volatile and may be affected by external factors such as financial, regulatory or political events. Trading on margin increases the financial risks.
Before deciding to trade in financial instrument or cryptocurrencies you should be fully informed of the risks and costs associated with trading the financial markets, carefully consider your investment objectives, level of experience, and risk appetite, and seek professional advice where needed.
Fusion Media would like to remind you that the data contained in this website is not necessarily real-time nor accurate. The data and prices on the website are not necessarily provided by any market or exchange, but may be provided by market makers, and so prices may not be accurate and may differ from the actual price at any given market, meaning prices are indicative and not appropriate for trading purposes. Fusion Media and any provider of the data contained in this website will not accept liability for any loss or damage as a result of your trading, or your reliance on the information contained within this website.
It is prohibited to use, store, reproduce, display, modify, transmit or distribute the data contained in this website without the explicit prior written permission of Fusion Media and/or the data provider. All intellectual property rights are reserved by the providers and/or the exchange providing the data contained in this website.
Fusion Media may be compensated by the advertisers that appear on the website, based on your interaction with the advertisements or advertisers.