Weighing The Week Ahead: Should Investors Fear A Market Top?
Jeff Miller | May 05, 2019 02:37AM ET
The calendar is modest, with the big reports all hitting last week. Investors will never have more current information on the economy, the Fed, corporate earnings, and various risks than they do right now. It is difficult to guess what the punditry will do when given an open slate. We should be asking:
Should we fear a market top?
Last Week Recap
In Jill Mislinski , who packs a lot of relevant information into the weekly chart without sacrificing clarity.
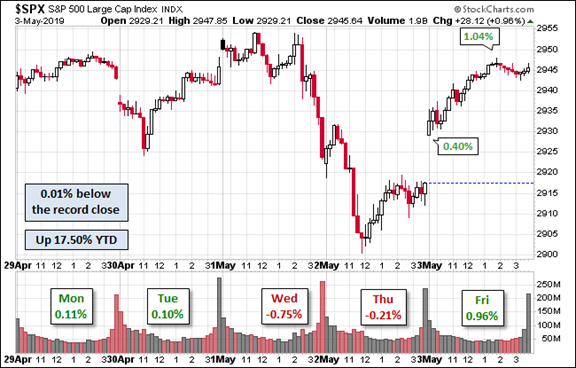
In another quiet week, the market was virtually unchanged. The trading range was only 1.8%. The volatility seemed higher to some, because of the two-day decline after the Fed meeting. As always, our indicator snapshot in the quant section below summarizes volatility and the VIX index in various time frames.
The News
Each week I break down events into good and bad. For our purposes, “good” has two components. The news must be market-friendly and better than expectations. I avoid using my personal preferences in evaluating news – and you should, too!
When relevant, I include expectations (E) and the prior reading (P).
New Deal Democrat’s high-frequency indicators are an important part of our regular research. In his post this week, Further Trend Toward Positive Numbers Could Signal A Renewed Boom, he reports that indicators in all time frames have become more positive. NDD remains skeptical and is watching indicators closely.
The Good
- Personal spending rebounded 0.9% even more than the expected 0.8% and P of 0.2%. But see personal income below in the “bad” section.
- Core PCE registered no increase versus the 0.1% expected and prior. The overall index was up 0.2%.
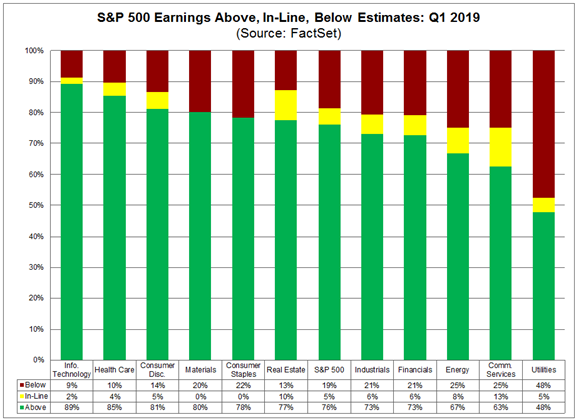
- Earnings growth remains strong. Brian Gilmartin describes the positive revisions to the S&P 500 estimates – now taking the lead over negative changes. John Butters (FactSet) updates earnings season results, which continue a beat rate higher than we have seen in the last five years. Here is the sector breakdown.
- Bespoke’s analysis includes the charts we have come to expect and the reasons behind the rebound. I enjoyed meeting their chief global strategist, George Pearkes, at last weeks National Association of Active Investment Managers meeting in Phoenix. George gave a fine presentation to the entire group and answered questions with aplomb.
- Factory orders increased by 1.9% in March, beating expectations of 1.6% and much better than February’s decline of -0.3%, revised from -0.5%.
- Pending home sales bounced 3.8% in April, beating expectations of 1.1% and the prior month decrease of -1.0%. Calculated Risk seasonal factors in home prices, which increased during the bubble and have declined since.
- Q1 productivity increased by 3.6% nicely beating expectations of 2.3% and the prior of 1.3% (revised downward from 1.9%). (Scott Grannis ).
- Employment gains were strong as measured by payrolls. The ADP and official reports, using alternative methods, are both important to those wanting a strong factual basis.
- ADP private employment increased 275K. (E 170K and P 151K revised up from 129K). (ADP (NASDAQ:ADP) ). Remember those who sifted through last month’s numbers until finding a subset of small business where there was a decline of 8000 jobs? I guess they couldn’t find one this month.
- Payroll jobs increased 263K. (E 200K and P 189K). James Picerno provides an early take with reactions from some key economists.
My own quick take was that it was not as good as it seemed, but my own concerns related to the Household survey.
New Deal Democrat , rather dour of late, identifies leading indicators of a slowdown or a recession.
My FATRADER colleague, Eric Basmajian , prefers to use a second derivative approach, measuring the pace of deceleration. He also highlights key sectors showing weakness, especially jobs in auto production.
Meanwhile, the headline number, and the low unemployment rate, dominated the headlines for regular news shows. It was also great for political spin. There is nothing unusual about that, except that the participants have changed sides.
The Bad
- The ISM manufacturing index, the only one of the PMI measures that has a long history, declined to 52.8, missing expectations of 55.0 and last month’s 55.3. Read the official ISM site for some color, including border delays with Mexico and suppliers moving out of China to avoid tariffs. ISM data suggests that a reading of 52.8, “if annualized, corresponds to a 2.9% increase in real GDP.”
- Light vehicle sales for March were only 16.4 million (SAAR), 5.7% lower than in February. The series is pretty noisy, including the erratic effects of holiday promotions. Jill Mislinski’s chart shows both the actual sales for each month as well as a moving average.
- The FOMC rate decision was exactly in line with expectations. A word or two in Chairman Powell’s press conference let to a negative market reaction. Top Fed analyst Tim Duy explains how . Here was the reaction (via the Daily Shot).
- Construction spending declined by -0.9% worse than the expected gain of 0.1% and February’s (downwardly revised) gain of 0.7%.
- Hotel occupancy decreased on a year-over-year basis. It is down -1.4%. Another alleged Easter effect? (Calculated Risk ).
- Rail traffic declined on a year-over-year basis. (Steven Hansen, GEI ).
- Initial jobless claims remained a bit off the levels of a month ago. 230K was the same as the prior week, suggesting that the “Easter timing” explanation was not correct.
- ISM non-manufacturing declined to 55.5 from last month’s 56.1 and missing expectations of 57.4. The ISM official site provides detail and color. They state, “The past relationship between the NMI® and the overall economy indicates that the NMI® for April (55.5 percent) corresponds to a 2.4-percent increase in real gross domestic product (GDP) on an annualized basis.”
- Employment reflected by the household survey was very different from the payroll report. The full article for much more) shows the downtick among prime-age workers.
The Ugly
There are so many incidents of senseless violence. We also have massive natural disasters, like the typhoon in India. Anyone not affected should be grateful and helpful to those who were.
The Week Ahead
We would all like to know the direction of the market in advance. Good luck with that! Second, best is planning what to look for and how to react.
The Calendar
After last week’s data avalanche, this week’s calendar is light. Inflation data will get attention, especially given discussion that the Fed is considering alternative measures. I am interested in the JOLTS report as insight into the labor market structure, but most simply use this to gauge employment growth.
Briefing.com has a good U.S. economic calendar for the week. Here are the main U.S. releases.
Next Week’s Theme
Last week’s calendar included the key reports, leaving us with a much lighter schedule this week. While earnings reports continue, we have the key trends in mind. Fresh data feature PPI and CPI. Since these are expected to increase more than last week’s PCE measure, there could be some talk about the Fed switching to an alternative measure.
I haven’t seen a good synthesis of what we learned in the fragmented methods of financial media. We should be asking:
Should investors fear a market top?
Last week I provided a guide for data interpretation. It was not as much fun as the cheat sheet based upon recent FedSpeak. [There was no change of policy. Nearly all Fed members have weighed in after the employment report. The Fed is “patient” and on hold.]
Does the evidence support the base case of 2 – 2.5% growth? That should be the question for each report – not whether there is a small change from the prior month. [It was a clean sweep. While some reports were lower than expectations nothing suggested a violation of our base case.]
I have a few additional conclusions in today’s Final Thought.
Quant Corner and Risk Analysis
I have a rule for my investment clients. Think first about your risk. Only then should you consider possible rewards. I monitor many quantitative reports and highlight the best methods in this weekly update, featuring the Indicator Snapshot.
Short-term and long-term technical conditions continue at the most favorable level. Our fundamental indicators have remained bullish throughout the December decline and rebound. The C-Score reflects the increase in headline inflation, despite slight steeping in the yield curve. I am watching this closely, including analyzing signs of possible confirmation of higher recession odds. We remain well within the warning period.
The Featured Sources:
Bob Dieli : Business cycle analysis via the “C Score.
Brian Gilmartin : All things earnings, for the overall market as well as many individual companies.
RecessionAlert : Strong quantitative indicators for both economic and market analysis.
employment model.
Big Four indicators most important for recession dating. Here is the current picture.
The picture has a few red spots but remains strong.
Guest Commentary
“Davidson” (via Todd Sullivan ) explains the oil inventory build that has depressed oil prices and energy ETFs – refinery downtime for capacity upgrades.
Exxon (NYSE:XOM) has reportedly restarted its refineries after being shutdown for capacity upgrades, but other refiners have shutdown for similar capacity upgrades. The Net-Net is that refining activity is unusually low for this time of year and we see a sharp drawdown in gasoline inventories which are usually building for summer demand.
We can only watch to see when refining activity returns to normal seasonal levels.
Insight for Traders
Check out our weekly “Stock Exchange.” We combine links to important posts about trading, themes of current interest, and ideas from our trading models.Forbes article . As he often does, Dr. Brett highlights principles that are important for traders and investors alike. Here is a key quotation:
Many traders focus on their results–their P/L–and never make the process changes that could lead to sustained results. A great deal of writings in the area of trading psychology emphasize the changes that traders should make–not actual techniques traders could employ to make those changes.
Brett made a dynamic presentation at the NAAIM conference, drawing rave reviews. His comments inspired my own ideas about how investors become preoccupied with the short-term implications of a trade. The immediate dollar result is not the best criterion, despite its popularity. transportation sector focuses on only four candidates (you’ll recognize them all) from airlines, air freight, trucking, railroads and other transports.
discussing his “dirty dozen” choices for 2019 .
Peter F. Way sees more upside in Facebook (NASDAQ:FB) (F).
Peter F. Way maintains that the best auto stock does not make autos. What is necessary for the wheels to go ’round? His unique, market-maker method displays a risk reward chart for this universe.
My colleague at FATRADER, Part Two .
Charlie Munger prefers Costco (NASDAQ:COST) to Amazon (NASDAQ:AMZN). (Warren Buffett pick ?
Or how about the #3 off-price retailer, Burlington Stores (BURL). (Barron’s ).
A bottom in Gilead (NASDAQ:GILD). (Ploutos reviews the dividend aristocrats, including YTD performance and long-term comparisons.
The Rose Portfolio had a great April, with a 19.7% increase in income over April of 2018. This is a fully transparent portfolio without a lot of turnover.
It is also important to know when to sell your dividend stock. Lyn Alden Schwartzer writes ,
Gold stocks, meaning companies that mine gold or finance gold production, can potentially throw a wrench in a value investor’s plan. Gold is an esoteric commodity; a substance that has ideal characteristics to store wealth but is endlessly debated on how to value it. It produces no cash flows, which throws out discounted cash flow analysis as a valuation tool. The bulk of it is not consumed by industry, so the immediate balance between supply and demand does not dictate price, since most gold ever mined is still stored and can be sold. And yet, in order to value gold stocks as businesses, we need to be able to determine if gold is grossly overvalued, deeply undervalued, or somewhere in the middle. Hence the problem.
Trading in financial instruments and/or cryptocurrencies involves high risks including the risk of losing some, or all, of your investment amount, and may not be suitable for all investors. Prices of cryptocurrencies are extremely volatile and may be affected by external factors such as financial, regulatory or political events. Trading on margin increases the financial risks.
Before deciding to trade in financial instrument or cryptocurrencies you should be fully informed of the risks and costs associated with trading the financial markets, carefully consider your investment objectives, level of experience, and risk appetite, and seek professional advice where needed.
Fusion Media would like to remind you that the data contained in this website is not necessarily real-time nor accurate. The data and prices on the website are not necessarily provided by any market or exchange, but may be provided by market makers, and so prices may not be accurate and may differ from the actual price at any given market, meaning prices are indicative and not appropriate for trading purposes. Fusion Media and any provider of the data contained in this website will not accept liability for any loss or damage as a result of your trading, or your reliance on the information contained within this website.
It is prohibited to use, store, reproduce, display, modify, transmit or distribute the data contained in this website without the explicit prior written permission of Fusion Media and/or the data provider. All intellectual property rights are reserved by the providers and/or the exchange providing the data contained in this website.
Fusion Media may be compensated by the advertisers that appear on the website, based on your interaction with the advertisements or advertisers.