Weekly S&P 500 ChartStorm: Stock Stats; Bear Market Rallies; Risk Indicators
Callum Thomas | May 29, 2022 02:13AM ET
Welcome to the Weekly S&P500 #ChartStorm —a selection of 10 charts which I hand pick from around the web and post on Twitter.
These charts focus on the S&P 500 (US equities); and the various forces and factors that influence the outlook - with the aim of bringing insight and perspective.
1. Scintillating Stock Market Statistics: The market was up 6% last week. Historically, on average, subsequent returns were positive most of the time, and often materially so.
(albeit note the outliers/exceptions: 2008 financial crisis, 1974 inflation shock, early-2000’s dot-com bubble bursting, and 1980 when Fed Chair Volcker hiked the economy into recession to get inflation under control…)
2. Recession Session: In terms of Recessionary vs Non-Recessionary stock market corrections, it sure does look like we are skewing toward the recessionary end of the scale in this chart. But the key point is that the answer as to whether this is going to be a more drawn out and deeper bear market will depend on recession: yes or no.
3. Bear Market Rallies: Beware of the #BearMarketRally
As a reminder, if this is actually a bear market that we are in right now, it will likely feature numerous and very seductive and very confusing bear market rallies.
Good for trading/positioning, but can also be a trap.
4. Upside-Downside Ups and Downs: Here's the rolling counts of extreme upside vs downside volatility (percent changes above/below a certain threshold: the original was daily and 1% +/- threshold). I mentioned this indicator a while back, and @exposurerisk has run with this alternative indicator, dubbing it the Thomas Counts.
But anyway, the key point is it puts on clear display the shifts in market regime from upside frenzy to downside fear. It's charts like this (and the macro backdrop) that make me think we're still early in the bear phase, and that this does represent a market regime change rather than a reversion to “buy the dip“.
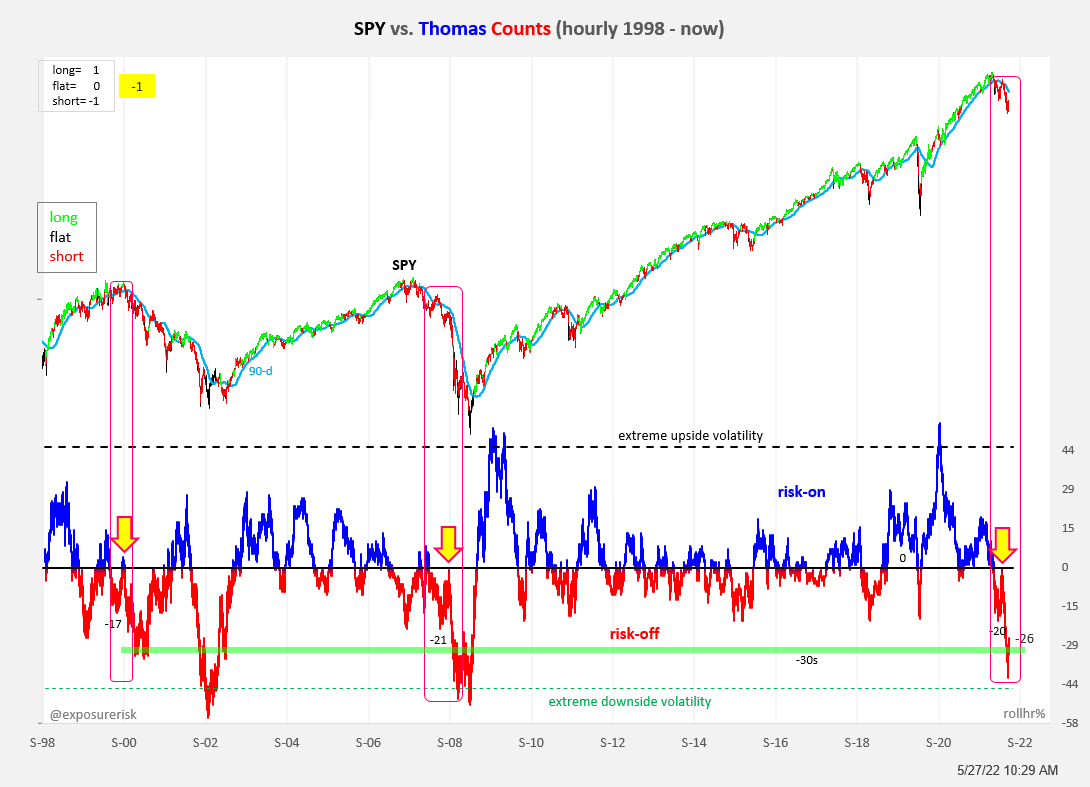
Source: @exposurerisk
5. Valuation Heights: Some folk are already saying "Hi, Value" …while others are still saying "High Value!" Meanwhile, I look at this chart and say it still looks a ways to go before all the excesses are worked through.
6. S&P 500 Job Listings: Glance at this chart, looks like the labor boom has peaked…
"total new job postings for the S&P 500 companies further fell in April to 853K, the lowest level since July 2021"
7. Peak Problems—Supply Chain Edition: Seems like companies are starting to complain less about supply chain issues... peak supply chain problems?
Said it before: one way to fix supply chain problems is to fix (stimulus-driven) excess demand: after all, taken to the extreme: no demand = no backlogs. And that's what will get the green line down.
Source: @FactSet
8. Great Rotation: only comment I have on this one (it speaks for itself) is to remind you that this chart is benchmark-relative… and the benchmark is still heavily skewed to those techy sectors (dark blue line).
9. Retail Over and Out: Maybe a grim paraphrasing of the term from last week “VTI and Chill“ to "Liquidate and Chill"
10. European Equities: 2008 or 2011?
(the last times sentiment moved like this was in 2008 when it foreshadowed a much deeper fall to come, but also in 2011 where it fell in reflection of real macro challenges but the stock market ranged and stagnated for a bit rather than crashing further …remember, bull markets and bear markets are not the only answer: crab markets are also a thing (where markets just range and go sideways)
BONUS CHART >> got to include a goody for the goodies who subscribed.
Macro Sentiment and the Stock Market: One of the things we need to remember is that the macro backdrop has been steadily worsening over the past year, and it represents a flip or a coming full-circle of the momentous macro backdrop that we enjoyed in the wake of the pandemic stimulus packages.
This chart shows global equities (MSCI All-Country World Equity Index, in local currency terms) against a composite of macro-related sentiment indicators from Consensus Inc. (Treasuries, commodities, currencies, equities). Key point is it’s gone from extreme optimism to now slightly net-bearish.
Now, some might say this is a nice and good healthy reset. But my experience is that sentiment indicators like this don’t just reset down to neutral and then take-off again, they usually overshoot, get washed out, and then turn up when something in the macro actually changes (i.e. usually when the monetary policy cycles turn).
Also, technicians should have picked up that the indicator made a lower high while the index made a higher high—a classic bearish divergence.
Pattern recognizers will also note that it kind of looks eerily similar to 2008.
All this is to say I don’t think we’re out of the woods just yet. I don’t think we get let off that lightly after such a prolonged (and more recently: preposterous) period of excess. Proceed with caution.
Trading in financial instruments and/or cryptocurrencies involves high risks including the risk of losing some, or all, of your investment amount, and may not be suitable for all investors. Prices of cryptocurrencies are extremely volatile and may be affected by external factors such as financial, regulatory or political events. Trading on margin increases the financial risks.
Before deciding to trade in financial instrument or cryptocurrencies you should be fully informed of the risks and costs associated with trading the financial markets, carefully consider your investment objectives, level of experience, and risk appetite, and seek professional advice where needed.
Fusion Media would like to remind you that the data contained in this website is not necessarily real-time nor accurate. The data and prices on the website are not necessarily provided by any market or exchange, but may be provided by market makers, and so prices may not be accurate and may differ from the actual price at any given market, meaning prices are indicative and not appropriate for trading purposes. Fusion Media and any provider of the data contained in this website will not accept liability for any loss or damage as a result of your trading, or your reliance on the information contained within this website.
It is prohibited to use, store, reproduce, display, modify, transmit or distribute the data contained in this website without the explicit prior written permission of Fusion Media and/or the data provider. All intellectual property rights are reserved by the providers and/or the exchange providing the data contained in this website.
Fusion Media may be compensated by the advertisers that appear on the website, based on your interaction with the advertisements or advertisers.