Weekly S&P 500 Chart Storm: Sticking To The Seasonality Script For VIX Too?
Callum Thomas | Nov 22, 2021 12:22AM ET
The S&P 500 ChartStorm is a selection of 10 charts which I hand pick from around the web and post on Twitter .The purpose of this post is to add extra color and commentary around the charts.
The charts focus on the S&P 500 (US equities); and the various forces and factors that influence the outlook—with the aim of bringing insight and perspective.
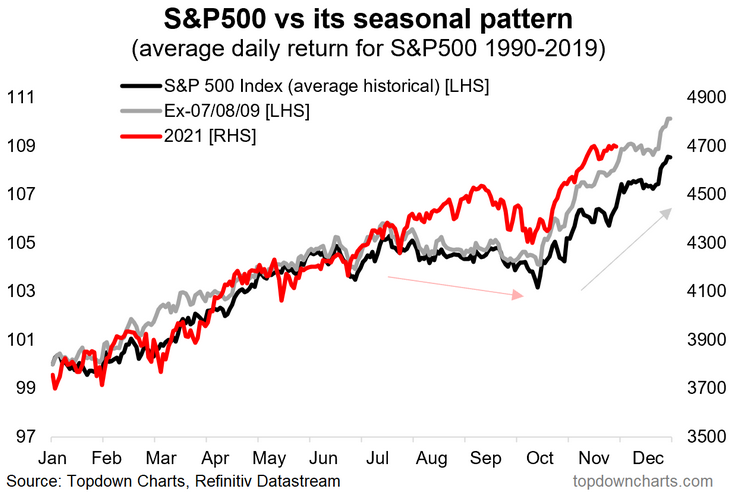
1. S&P 500 Seasonality Chart: It’s everyone’s favorite chart updated again (maybe for the last time this year?). The S&P 500 has been sticking to the seasonality script through most of this year… makes me think about Murphy’s Law tho—maybe the market will start to improvise and go off-script? Either way, the next few weeks seasonally look like sideways action.
Source:
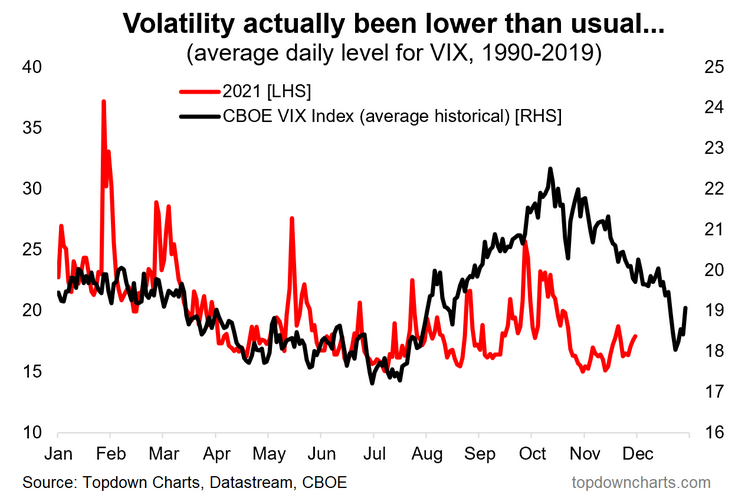
2. Volatility Seasonality: A twist on the previous chart—same concept, but this time with implied volatility. I find it interesting to note that the VIX has actually been a bit lower than usual for this time of the year (and trending up short-term…). One last VIX spike before year-end?
Source:
3. Stockmarket Statistics: What happens after the market goes up a “crazy overheated” 20%+ over the course of a year?
More Gains.
Historically most of the time if the market closed up 20%+ for the year, the next year was also positive (84% of the time). As of writing, the market is up some 27% YTD (albeit, this year ain't over yet!).
Source:
4. Bad Breadth? Fully 1/3rd of stocks are in a downtrend. (defined as trading below their respective 200dma)
Will this bearish divergence be a problem?
Source:
5. GAARP vs GAAAP: On this metric, growth stocks are the most expensive ever vs value stocks. So it begs the question… Growth at a reasonable price? or Growth at *any* price? (but then again, who defines what "reasonable" is in a market like this!)
Source:
6. Low Energy: Energy stocks are attempting to turn the corner vs the rest of the market, but face high hurdles from the raging tech bull market, rise of ESG investing and regulatory/political hurdles, not to mention commodity market volatility.
What comes down must go up? (or something else?)
Source:
7. Buybacks Back: New all-time high for buybacks in Q3 (with 95% reported). Always makes me wonder these trends — you see the majority of buybacks occurring near market peaks… i.e. when valuations are extreme expensive. The opposite of value investing: buy more when its expensive, buy less when it’s cheap—seems like upside-down logic to me, but then again I am a simple man.
Source:
8. Payout Ratio: As an interesting follow-on to the ATH in buybacks/dividends, it’s interesting to note that the dividend payout ratio is actually below average...
Scope to return more cash to investors?
Source:
9. Buffett Indicator: Looks like this indicator has reached a permanently higher plateau! (kidding of course—echoing the famous last words of Irving Fisher back in 1929) Interesting stat to note: to make this indicator as cheap as where it got to during the financial crisis lows the market would need to fall over 70%. Definitely not a prediction, but interesting nonetheless. I would say I have multiple quibbles with this indicator, I think CAPE and ERP are better valuation metrics, but that’s a topic for another day.
Source:
10. Buffett the Compounder: Speaking of Buffett, a lesson in compounding.
Source:
Thanks for following, I appreciate your interest!
Trading in financial instruments and/or cryptocurrencies involves high risks including the risk of losing some, or all, of your investment amount, and may not be suitable for all investors. Prices of cryptocurrencies are extremely volatile and may be affected by external factors such as financial, regulatory or political events. Trading on margin increases the financial risks.
Before deciding to trade in financial instrument or cryptocurrencies you should be fully informed of the risks and costs associated with trading the financial markets, carefully consider your investment objectives, level of experience, and risk appetite, and seek professional advice where needed.
Fusion Media would like to remind you that the data contained in this website is not necessarily real-time nor accurate. The data and prices on the website are not necessarily provided by any market or exchange, but may be provided by market makers, and so prices may not be accurate and may differ from the actual price at any given market, meaning prices are indicative and not appropriate for trading purposes. Fusion Media and any provider of the data contained in this website will not accept liability for any loss or damage as a result of your trading, or your reliance on the information contained within this website.
It is prohibited to use, store, reproduce, display, modify, transmit or distribute the data contained in this website without the explicit prior written permission of Fusion Media and/or the data provider. All intellectual property rights are reserved by the providers and/or the exchange providing the data contained in this website.
Fusion Media may be compensated by the advertisers that appear on the website, based on your interaction with the advertisements or advertisers.