U.S. Stock Indices Reach All Time Highs Even As Advance Slows
Urban Carmel | Aug 22, 2016 06:06AM ET
Summary: Resilient macro economic data as well as healthy consumer and corporate balance sheets provide a bullish longer term back drop for US equities. While the indices traded at new all-time highs this week, the pace of the advance has markedly slowed. The S&P has effectively reached the 2200 "round number" milestone and some shorter term measures of investor sentiment show bullishness at their highest level since the end of 2014. There's been no price trigger, but a set up for a retrace of some of gains since June is in place.
At our last market summary at the end of July, the S&P had closed at 2173. In the three weeks since, the index has gained just 10 points, or 0.5%. In the last two weeks, the index has gained exactly 1 point.
Almost all of the gains in the past three weeks came on August 5th, the day when non-farm payrolls were better than expected. The S&P gained nearly 1% that day and has done little since.
Our view has been that US equities are most likely in a final "wave 5" of their 7 year bull market, supported by solid breadth, skeptical long term sentiment and continued macro expansion.
That view continues to be validated: SPX, NDX and DJIA all made new ATHs this week, and RUT made a new 1-year high. The trend remains higher.
Strong gains in July are often partially retraced in August and September, months that are seasonally weak and also susceptible to increased volatility. That has so far not been the case: volatility has been persistently low and the indices continue to grind higher.
This is why we always distinguish between a "set-up" for prices to move up or down and a "trigger" to indicate that the expected set-up has been activated.
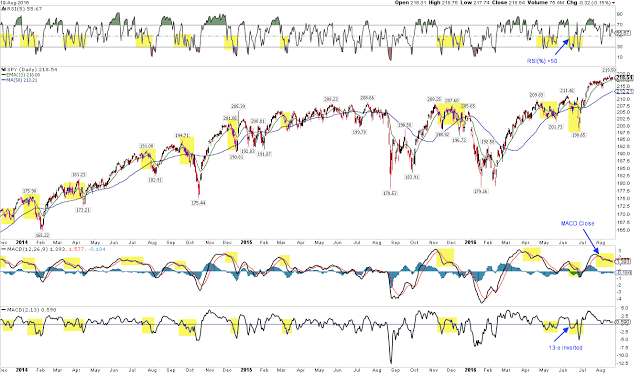
The S&P remains above all its moving averages. With little gain over the past two weeks, it's not surprising that the 5-dma has flattened and the 13-ema is just below it. The likely "trigger" for a retrace will be the 13-ema inflecting lower.
It's not perfect, but a when the MACD is declining (lower panel), RSI is under 50 (upper panel) and the 13-ema has inflected lower (lowest panel), a drop in the S&P is usually underway. Right now, only the MACD is weak; RSI and 13-ema are close to confirming, but haven't yet.
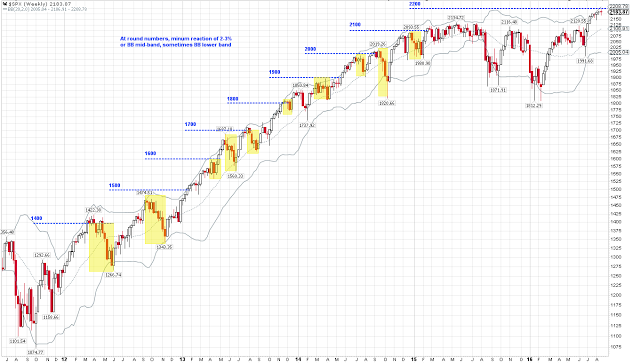
Part of the "set up" for a partial retrace of recent gains is the SPX nearing 2200 "round number" resistance. SPX's recent high was at 2194. Recall, SPX has had a consistent tendency to react as it nears each new "round number" milestone for the first time.
The smallest reaction (2%) was in 2013 at 1800. Most often the reaction is more than 3%. The last two were 10% (at 2000) and 6% (at 2100). A move to the Bollinger middle band implies a correction of about 4%.
Longer term sentiment remains skeptical. Fund flows to equities have been consistently negative in 2016; money has been flowing to the safety of bonds. This is unlike 2007, for example, or even the heady period in 2013-14 that preceded the subsequent sideways move in US equities (from JP Morgan).
Shorter term measures of sentiment show more bullishness, although not consistently so. Survey data from AAII and Investors Intelligence are neutral, while investors surveyed by NAAIM are clearly bullish. A composite measure of sentiment shows investors as bullish now as in late 2014 before a 5% fall in SPX.
These measures do not pin point tops: excessive bulls in May 2013 was followed by a 4% rise in SPX, and then a 6% fall (in yellow). But, overall, short term sentiment supports a reaction being ahead.
The current period will be remembered for its low volatility. Volatility is mean reverting but the catch is that the reversion can be months away, during which the index can move higher.
The discount of 1-month to 3-month volatility has been persistently lower than any time in the past 10 years. Only two prior situations are close, both in 2012. This is not a sufficient sample from which to draw any firm conclusions about what is likely to happen next.
That said, it's noteworthy that SPX dropped 10% in the first instance; in the second instance, SPX rose 3% and then dropped 8% a month later.
The push to new highs in equities is supported by resilience in the macro data. New housing starts in the US remain near an 8-year high. Real retail sales in July were up 1.4% yoy and at a new ATH. Consumption is not showing any pre-recessionary flattening or weakness.
Prolonged growth in consumption will likely be supported by consumers' low leverage: their debt burden relative to disposable income is near a 30 year low. Prior cycles have ended when consumers' debt burden has been near cycle highs. That is not the case at present.
Moreover, the most recent data show consumer credit delinquencies continuing to decline to a new 9 year low. There is no deterioration in credit worthiness taking place (from Calculated Risk).
The same is true for corporations. Debt levels have, of course, increased with persistently low interest rates. But corporate cash has also grown. Debt net of cash relative to EBITDA is not high (from DB).
Moreover, the recent rise in corporate leverage is primarily energy related. Energy sector debt relative to EBITDA rose from just over 1 to more than 12 as the oil price (and, therefore, profits) collapsed in the past two years.
One of the knocks on the current economic recovery is that corporate investment spending is poor. But investment in equipment and structures as a portion of the total economy has been in secular decline for more than 30 years.
Investment in physical assets has been replaced by growing investment in intellectual property (from Calculated Risk).
Moreover, the recent decline in investment in structures is primarily related to capacity being reduced in the energy sector. In 2Q16, non-residential investment in structures outside of the energy sector increased at 5.5% annual rate.
That's also true for companies in the S&P: outside of the energy sector, capital expenditures continue to rise (from FactSet).
Taken together, there are good reasons to believe that corporate investment will continue to support economic growth.
Trading in financial instruments and/or cryptocurrencies involves high risks including the risk of losing some, or all, of your investment amount, and may not be suitable for all investors. Prices of cryptocurrencies are extremely volatile and may be affected by external factors such as financial, regulatory or political events. Trading on margin increases the financial risks.
Before deciding to trade in financial instrument or cryptocurrencies you should be fully informed of the risks and costs associated with trading the financial markets, carefully consider your investment objectives, level of experience, and risk appetite, and seek professional advice where needed.
Fusion Media would like to remind you that the data contained in this website is not necessarily real-time nor accurate. The data and prices on the website are not necessarily provided by any market or exchange, but may be provided by market makers, and so prices may not be accurate and may differ from the actual price at any given market, meaning prices are indicative and not appropriate for trading purposes. Fusion Media and any provider of the data contained in this website will not accept liability for any loss or damage as a result of your trading, or your reliance on the information contained within this website.
It is prohibited to use, store, reproduce, display, modify, transmit or distribute the data contained in this website without the explicit prior written permission of Fusion Media and/or the data provider. All intellectual property rights are reserved by the providers and/or the exchange providing the data contained in this website.
Fusion Media may be compensated by the advertisers that appear on the website, based on your interaction with the advertisements or advertisers.