Weekly Inflation Outlook: Diversification Changes With Correlations
Michael Ashton | Oct 10, 2022 04:03AM ET
Last week, I reminded readers that high-inflation environments are associated with lower equity multiples, all else being equal, and that that phenomenon has been true for more than a hundred years. Of course, the market reacted to my observation by launching equities sharply higher but that’s why they play the games. I’m not trying to be a trader with these observations; I’m trying to be an investor.
This week, I thought I’d share another phenomenon that I’ve been highlighting for a couple of years now, but which is just getting to the ‘interesting’ zone. Although the notion that equities tend to have lower multiples in inflationary times is fairly well-known (I cited papers from the 1970s in last week’s article), somewhat less-appreciated is the fact that the correlation between stocks and bonds is very different when inflation is high, than when it’s low. As it happens, the happy accident of the last quarter-century that stocks and bonds were inversely correlated tended to help the popularity of the '60-40' portfolio, which relies on the notion that stocks and bonds react differently to growth and recession. Ergo, 60-40 is risk-reducing diversification that comes with only a small performance cost. Or, so the story goes.
It turns out that this is true when the predominant factor that investors are worried about is growth. Bonds respond poorly to growth, while stocks respond well to growth; the opposite is true for recession. So, when the growth factor is primary, the returns of stocks and bonds tend to be inversely correlated.
On the other hand, when the inflation factor is active these two asset classes become correlated. As we discussed last week, stocks respond poorly to inflation…and bonds obviously do as well. This isn’t a once-in-a-blue-moon thing. The reason that stocks and bonds have been inversely correlated for so long, and probably the primary reason that 60/40 is a benchmark today, is an artifact of the low inflation of the last quarter-century, which removed inflation risk from investors’ minds. Well, investors might remember this going forward.
I have been using the chart below for a long time now. It shows a rolling 3-year correlation in blue. When it is above zero, it means stocks and bonds are correlated and so 60/40 doesn’t reduce risk as much. When it is below zero, 60/40 has very different qualities. The red area shows the amount by which rolling 3-year average inflation was above or below 2.5%. Notice that the period of positive correlation coincides with the period of inflation above 2.5%.
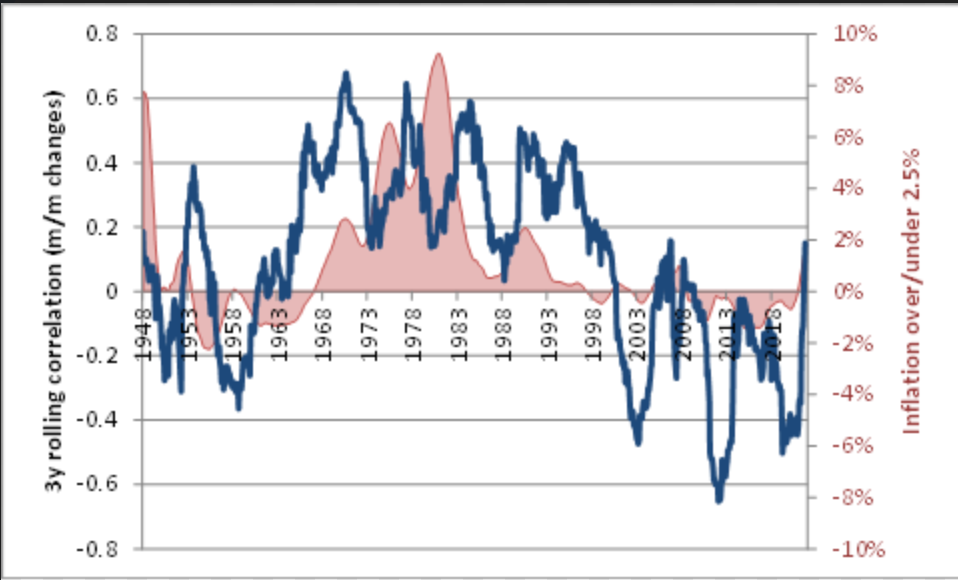
It is interesting that the inflection point happens to be around 2.5% on CPI, which roughly correlates to the Fed’s 2% target on PCE. I suppose that when inflation is persistently above the target, investors start to worry that the Fed doesn’t truly have it under control, and the inflation factor starts to matter. When it’s persistently below the target, investors figure the Fed is in control and so they can ignore inflation and just focus on the growth factor.
Incidentally, the chart also shows another key fact: misses on the high side are much bigger than misses on the low side. This is why inflation swaps and inflation breakevens should trade higher than expectations—because there should be some optionality associated with this asymmetry. Going one step further, it also suggests that being long breakevens as a core position can help the performance of a 60/40 portfolio that is exposed in both price and correlation to rising inflation. When inflation rises persistently, the breakeven position will be inversely correlated with the (now correlated) 60/40 portfolio. Even better would be inflation options, but you’ll have to ping me directly to talk about that.
Taking a Step Back…
Last week, I noted that the sloppiness of markets could persuade the Fed to at least ease off on the vigor of their rhetoric and possibly lower the trajectory of rate hikes. Right on cue, Fed heads did exactly that. San Francisco Fed President Daly, while calling inflation a “corrosive disease” requiring further rate hikes, also acknowledged that the decline in job openings (reported last week) and her own anecdotal discussions with businesses suggested that wage pressures could be abating soon. Markets, predictably, reacted quite favorably early in the week to any inkling there may be a temporary stay of execution.
However, this week we will see another CPI report and Core CPI is going to reaccelerate and possibly set a new high for this cycle. Readers will remember that Median CPI is still climbing, and last month set a new m/m high suggesting that pressures are still increasing. But there are signs in some quarters that rents are beginning to ease their torrid pace of growth, in which case we should see a near-term peak soon. If that happens this week, markets may rejoice further. Last month, though, the real story was that core services ex-rents appeared to really be taking the reins. That’s the part of CPI where, if you were looking for a wage-price spiral to take hold, you would see it. I’ll be very attentive to core services ex-rents.
Because in the short term the Fed can nudge markets with their words. But in the long term, they’ll need actions and will have to respond to what the economy gives them. So far, the Federal Reserve has been focusing actions on rates, and not money, and as a result any inflation gains they have will be slow, late, and disappointing.
Disclosure: My company and/or funds and accounts we manage have positions in inflation-indexed bonds and various commodity and financial futures products and ETFs, that may be mentioned from time to time in this column.
Trading in financial instruments and/or cryptocurrencies involves high risks including the risk of losing some, or all, of your investment amount, and may not be suitable for all investors. Prices of cryptocurrencies are extremely volatile and may be affected by external factors such as financial, regulatory or political events. Trading on margin increases the financial risks.
Before deciding to trade in financial instrument or cryptocurrencies you should be fully informed of the risks and costs associated with trading the financial markets, carefully consider your investment objectives, level of experience, and risk appetite, and seek professional advice where needed.
Fusion Media would like to remind you that the data contained in this website is not necessarily real-time nor accurate. The data and prices on the website are not necessarily provided by any market or exchange, but may be provided by market makers, and so prices may not be accurate and may differ from the actual price at any given market, meaning prices are indicative and not appropriate for trading purposes. Fusion Media and any provider of the data contained in this website will not accept liability for any loss or damage as a result of your trading, or your reliance on the information contained within this website.
It is prohibited to use, store, reproduce, display, modify, transmit or distribute the data contained in this website without the explicit prior written permission of Fusion Media and/or the data provider. All intellectual property rights are reserved by the providers and/or the exchange providing the data contained in this website.
Fusion Media may be compensated by the advertisers that appear on the website, based on your interaction with the advertisements or advertisers.