SPX: Short Term Support At 2085 And 2070 Pivots
Tony Caldaro | Nov 29, 2015 04:12AM ET
REVIEW
The market started the holiday shortened week at SPX 2089. The market rallied to one point below the recent rally high at SPX 2097 on Monday. Then declined, helped by a gap down opening, to SPX 2070 on Tuesday. After hitting that low in the morning, the market rallied to SPX 2094 late Tuesday, and then traded in a narrow range to end the week at SPX 2090. For the week, the SPX/DOW were mixed, the NDX/NAZ were mixed, and the DJ World lost 0.2%. Economic reports for the week were solidly positive. On the uptick: Q3 GDP, Case-Shiller, personal income/spending, durable goods, the FHFA, new home sales, the WLEI, plus weekly jobless claims improved. On the downtick: existing home sales, GDPN, and consumer confidence/sentiment. Next week’s reports will be highlighted by monthly Payrolls, the FED’s Beige book, and the ISMs.
LONG TERM: bull market
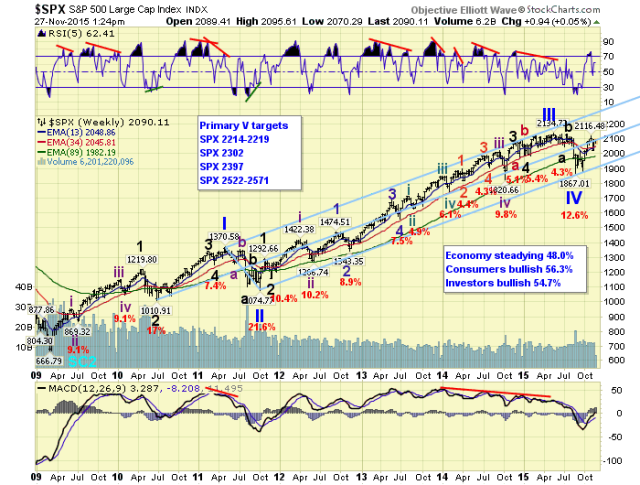
While the three wave Primary IV decline, from mid-May to late-August, has been reversed by the current three month uptrend. Some are still expecting Primary IV to reassert itself on the downside. Judging by the characteristics of this bull market, the chances of this occurring are slim to none. The late-August low ended the largest correction since Primary II, was a zigzag alternating with the elongated flat of P2, and generated the most oversold monthly RSI since P2. Clearly this looks like a completed pattern, and the market has responded accordingly.

We continue to label this six year bull market as a five primary wave Cycle wave [1]. Primary waves I and II ended in 2011, and Primary waves III and IV ended in 2015. Primary wave V has been underway since that late-August low. When Primary V concludes it will end this lengthy bull market. Since this is a Cycle wave advance, a Cycle wave bear market will follow. Typically markets lose 45% to 50% of their value during these types of declines. With 55% of the world’s indices already in confirmed bear markets, and another 30% looking like they may already be in bear markets, Primary V will certainly run into some headwinds after it makes new highs. Our initial upside targets for P5 remain on the weekly chart above.
MEDIUM TERM: uptrend
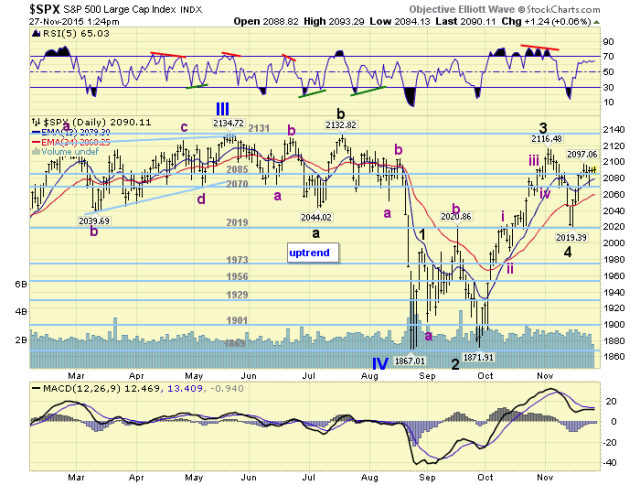
The uptrend from the Primary IV low continues to unfold as expected: Major wave 1 at SPX 1993 in late-August, Major wave 2 at SPX 1872 in late-September, Major wave 3 at SPX 2116 in early-November, Major wave 4 at SPX 2019 in mid-November, and Major wave 5 currently underway. With Major wave 2 an irregular zigzag, and Major 4 a simple zigzag, we have alternation. And, both lows generated similar oversold conditions on the daily RSI.

Major wave 5 started off like it was going to unfold more like Major 1 than the subdividing Major wave 3. While it was quick to get going to the upside, it sort of stalled this holiday week. This suggests it may produce some subdivisions of its own. Major wave 1, for example, only had five Intermediate waves, and lasted only a few days. Major wave 3 had many subdivisions, within its five Intermediate waves, and lasted for more than one month. Major wave 5 looks like it will be something in between. Medium term support is at the 2085 and 2070 pivots, with resistance at the 2131 and 2145 pivots.
SHORT TERM
The rally from the Major wave low at SPX 2019 has unfolded in five waves: 2067-2046-2097-2070-2094 thus far. We have labeled the first two waves Intermediates i and ii, and the following three waves as Minors 1, 2 and 3 of Intermediate iii. We took this labeling pattern because we have been expecting Int. iii to make new highs within the OEW 2145 pivot range. Using the previous waves of this uptrend as reference, this should occur. If it does not, then all five of these waves may be the Minor waves of Intermediate wave i. And, an Intermediate wave ii would follow shortly after the market reaches SPX 2097+. In either case there is really good support in the OEW 2070 pivot range.
Ideally, Intermediate iii should top out around the 2145 pivot. Then after a 20+ point pullback for Int. iv, an Int. v rally should reach at least the OEW 2170 pivot range. This is just a roadmap as we project, monitor and adjust. Short term support is at the 2085 and 2070 pivots, with resistance at SPX 2116 and the 2131 pivot. Short term momentum ended the week just above neutral.
Trading in financial instruments and/or cryptocurrencies involves high risks including the risk of losing some, or all, of your investment amount, and may not be suitable for all investors. Prices of cryptocurrencies are extremely volatile and may be affected by external factors such as financial, regulatory or political events. Trading on margin increases the financial risks.
Before deciding to trade in financial instrument or cryptocurrencies you should be fully informed of the risks and costs associated with trading the financial markets, carefully consider your investment objectives, level of experience, and risk appetite, and seek professional advice where needed.
Fusion Media would like to remind you that the data contained in this website is not necessarily real-time nor accurate. The data and prices on the website are not necessarily provided by any market or exchange, but may be provided by market makers, and so prices may not be accurate and may differ from the actual price at any given market, meaning prices are indicative and not appropriate for trading purposes. Fusion Media and any provider of the data contained in this website will not accept liability for any loss or damage as a result of your trading, or your reliance on the information contained within this website.
It is prohibited to use, store, reproduce, display, modify, transmit or distribute the data contained in this website without the explicit prior written permission of Fusion Media and/or the data provider. All intellectual property rights are reserved by the providers and/or the exchange providing the data contained in this website.
Fusion Media may be compensated by the advertisers that appear on the website, based on your interaction with the advertisements or advertisers.