Weekend Sentiment Summary: Overbought Conditions Abound
Tiho Brkan | May 19, 2013 06:35AM ET
Chart 1: VIX & S&P 500 divergence continues...
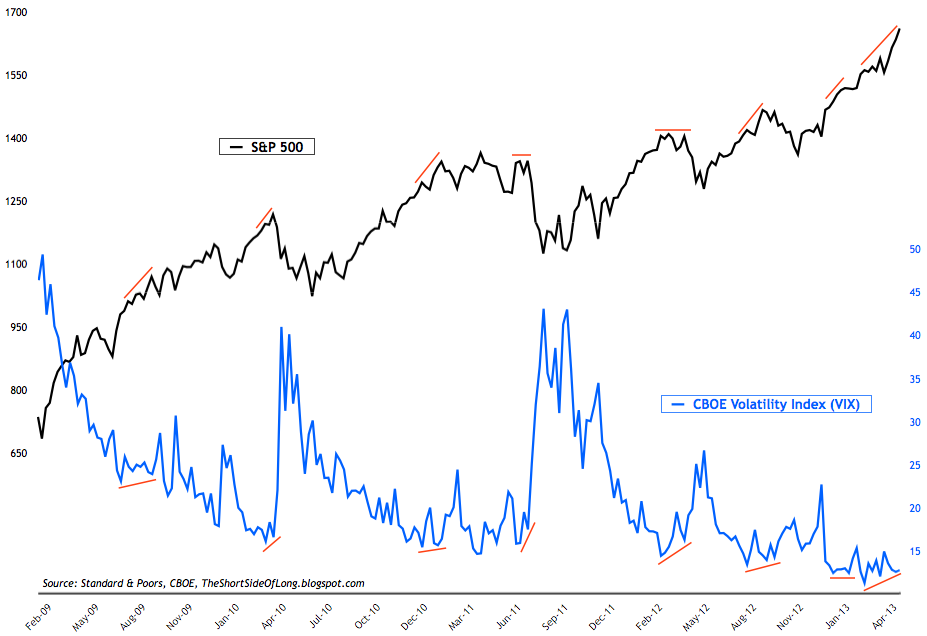
- While not an outright sentiment indicator, the Volatility Index (VIX) usually tends to lead the S&P 500 lower. Red divergence lines, in the chart above, show how VIX refuses to make a lower low while the stock market moves higher. Disagreement tends to be a warning signal majority of the time (doesn't always work). It seems that traders tend to buy protection in anticipation of an up-and-coming corrections. This is definitely a warning signal, which we've seen time and time again, throughout the current bull market.
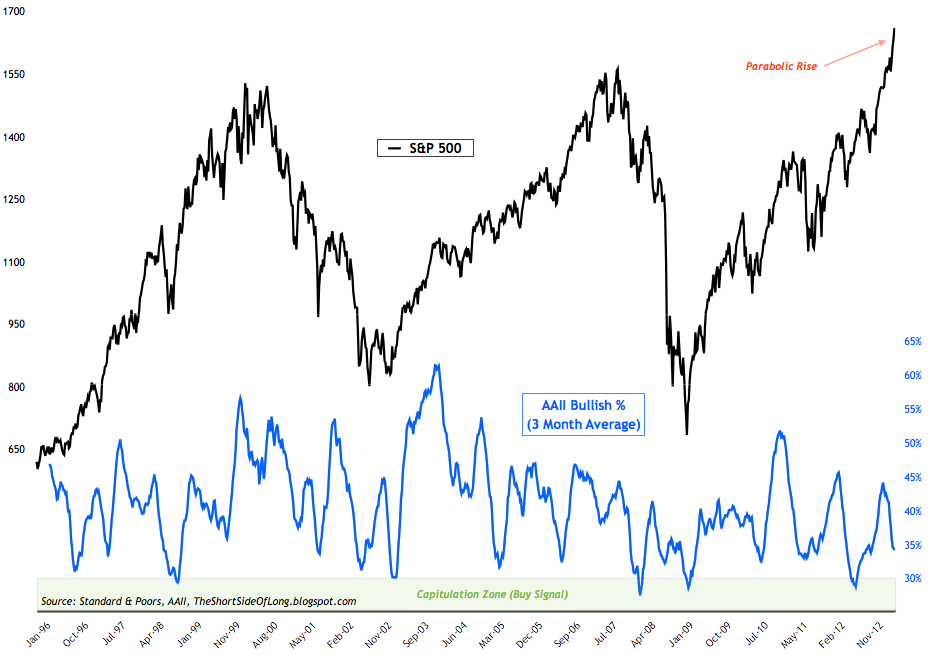
- This weeks AAII survey levels came in at 38.5% bulls and 29% bears. Bullish and bearish readings pretty much stayed the same from the prior weeks level. As already commented in previous sentiment posts, AAII sentiment levels remain below average, despite a parabolic rise in stock prices. However, this is not so rare. During a powerful stock rally in late 2006 and into early 2007, AAII sentiment was falling just as the market was peaking. In general, this indicator is much much better at predicting intermediate bottoms.
- Investor Intelligence survey levels came in at 54% bulls and 20% bears. Bullish readings rose by 2%, while bearish readings stayed exactly the same. Bull ratio remains on a "sell signal" and has now exceeded 73%, which is the highest level since the major market top in 2011. For referencing, the bull ratio chart can be seen by viewing the sentiment post from two weeks ago or by clicking clicking here .
- Public opinion on alternative currencies like Gold and Silver is still around depressed and extreme pessimism levels associated with previous intermediate bottoms. With the recent sell off in price, we are sure to see even less bulls in coming updates.
Trading in financial instruments and/or cryptocurrencies involves high risks including the risk of losing some, or all, of your investment amount, and may not be suitable for all investors. Prices of cryptocurrencies are extremely volatile and may be affected by external factors such as financial, regulatory or political events. Trading on margin increases the financial risks.
Before deciding to trade in financial instrument or cryptocurrencies you should be fully informed of the risks and costs associated with trading the financial markets, carefully consider your investment objectives, level of experience, and risk appetite, and seek professional advice where needed.
Fusion Media would like to remind you that the data contained in this website is not necessarily real-time nor accurate. The data and prices on the website are not necessarily provided by any market or exchange, but may be provided by market makers, and so prices may not be accurate and may differ from the actual price at any given market, meaning prices are indicative and not appropriate for trading purposes. Fusion Media and any provider of the data contained in this website will not accept liability for any loss or damage as a result of your trading, or your reliance on the information contained within this website.
It is prohibited to use, store, reproduce, display, modify, transmit or distribute the data contained in this website without the explicit prior written permission of Fusion Media and/or the data provider. All intellectual property rights are reserved by the providers and/or the exchange providing the data contained in this website.
Fusion Media may be compensated by the advertisers that appear on the website, based on your interaction with the advertisements or advertisers.