U.S. Stocks, Dollar, Precious Metals At Inflection Points
David Tablish | Dec 07, 2015 05:30AM ET
We had some pretty interesting price action in the stock markets this past Friday, and from my perspective, that was very positive. Let's start by looking at the Dow Jones Industrial Average (INDU) which has been showing an H&S consolidation pattern forming.
Last Thursday’s price action closed below the 200 dma which is another reason I exited my stock market trades in anticipation of Friday's numbers. But Friday’s rally closed the day just below the neckline and back above the 200 dma. What I find interesting: Thursday’s low was a reverse symmetry low taken from the left shoulder’s higher low on the far left hand side of the chart below, that matches the higher right shoulder low on the right side of the chart, which was Friday’s price action.
We now have two neckline symmetry lines. The neckline symmetry lines are just parallel lines taken from the big neckline that sometimes shows us where to look for the lows for the right shoulders. So at this point the reverse symmetry is as pretty as it gets, as shown by the S’s.
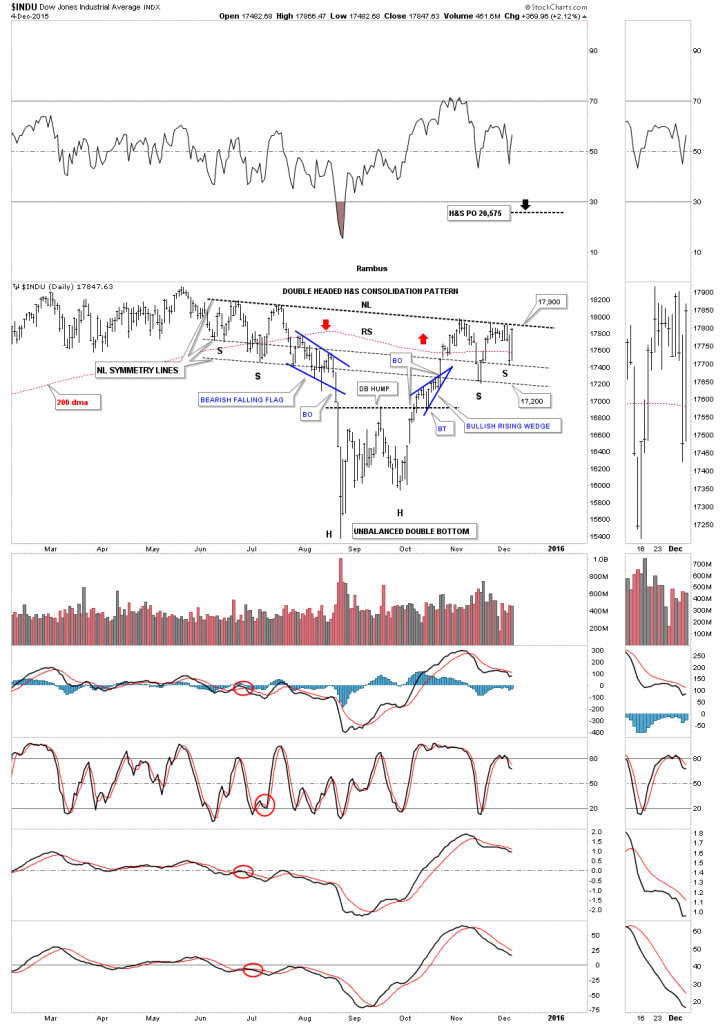
The volatile choppiness over the last 3 weeks or so—since the INDU first made contact with the neckline—looks like a triangle formation, which I would view as a halfway pattern to the upside. Below is the exact same chart as the one above, but this one has the blue triangle on it that is creating the right shoulder.
So, when we look at the Chartology since the August low, we can see a double bottom with the small blue bullish rising wedge and now the potential bigger blue triangle forming the right shoulder. This is all bullish price action in which the INDU has made higher lows and higher highs, except for the top rail of the blue triangle which has a slightly lower high at this point.
To confirm the H&S bottom or the blue triangle consolidation pattern is in place, the INDU will have to break out above 17,900 area. This is a fairly large H&S consolidation pattern that stretches back over the last six months to June, so I would expect a rally of intermediate term proportions at least up to the 20,000 area as a minimum.
One more thing before we leave the INDU daily charts. I’m sure most of you have heard the expression “shaking the bush" used with regard to the markets. It refers to a sharp decline which shakes everyone off the bush; Then the markets turn right around and rally back up, leaving most in disbelief. It only took three trading days to shake the bush once the blue bearish falling flag gave way to reach the August low. How many calls have you heard or read that this is the beginning of a new bear market in the stock markets?
Some of you may remember this daily epiphany or moment of clarity chart I posted back in October of this year, the day before the INDU broke out above the rounded top trendline in the Wednesday Report. What I was trying to show at the time was how nice and clean the breakouts and backtests were.
Note the breakout above the double bottom hump and clean backtest. Then there was the breakout of the big black dashed support and resistance line also with a clean backtest as shown by the red circle. Since the breakout above the rounded top trendline the INDU made one more attempt to backtest the big support and resistance line around the 17,100 area. The latest price action shows the potential blue triangle consolidation pattern that is building out.
The next chart for the INDU is a weekly look that shows the 2007 H&S top, the 2009 H&S bottom and how our current H&S consolidation pattern fits into the big picture. What’s interesting is that all three H&S patterns are close to being the same height.
Our current H&S consolidation pattern is actually the tallest of the three. I don’t know how many of you remember the 2011 correction, which was pretty scary at the time, but we just experienced the same thing in 2015.
Below is another weekly chart which shows how support and resistance works, as shown by the black dashed horizontal lines. This chart also shows our potential H&S consolidation pattern more clearly.
This first monthly chart for the INDU shows its bull market, which started in 2009, as a parallel uptrend channel. You can see there was a crack of the bottom trendline in August of this year, shaking the bush, which has been corrected.
I wasn’t going to show this long term monthly chart for the INDU, below, but it’s part of the very big picture, so here it is again, THE JAWS OF LIFE. The top rail of the bullish expanding triangle was originally broken to the upside two years ago, in November of 2013. It now has had three successful backtests to the top rail with the August low cracking the top rail but not breaking it. Shaking the bush yet again?
Most investors have their own set of indicators which they like to use to gauge the health of the stock markets. This first indicator chart is one I've shown many times. It measures the down-to-up volume or capitulation volume when I’m looking for a low.
The red vertical dashed lines shows a modest amount of capitulation while the black dashed vertical lines shows a more pronounced amount of capitulation volume. Note the number of black arrows that were made during our latest bottom. There was a lot of capitulation taking place, which suggested to me that a healthy bottom may be forming.
Note the last small amount of capitulation that took place in November of this year, as shown by the red dashed vertical line that marked the latest low. What I find interesting is that with the big drop on Thursday of this past week, there was very little capitulation volume taking place—which I’m reading as those that wanted to sell have already done so. So is the path of least resistance now to the upside?
This next chart measures the percent of stocks in the NASDAQ 100 (NDX) that are trading above their 50 day moving average. Basically, when stocks are trading below the yellow shaded area, you have a sell signal. When the index trades back above the yellow shaded area you have a buy signal.
As long as the number of stocks in the NDX stays above the bottom of the yellow shaded area, this index remains on a buy signal. So far, we’ve had three touches to the top of the yellow shaded buy-and-sell zone, which remains on a buy signal.
The next indicator chart shows the broader measure of health in the stock markets by using the NYAR200 Index, which shows the percent of NYSE stocks trading above their 200 day moving average. The SPX is on top and the NYA200 is below.
Everyone has their own interpretation regarding how to use an indicator chart like this. I like to use it when I'm looking for an important bottom and nothing else.
First, note the bear market low in 2008 and 2009 which formed a double bottom on both charts. Here the indicator chart shows a positive divergence as the SPX made a lower low and the indicator chart made a higher low. Then it did the same at the important low in 2011 where the indicator chart made a positive divergence to the SPX.
Now on to our most recent low, which shows no divergences but a double bottom on both charts. Many are looking at this as stock market weakness since the SPX is trading near its all time highs while the indicator chart is still way below its highs.
What I see when I look at this chart is that the stock markets have had a small correction while the indicator chart has had a major correction. This now leaves plenty of room for the stock market to rally before it becomes overbought again, as shown by the previous two double bottoms.
Below is a monthly look at the same two charts. Here, the brown shaded area shows where general support comes into play.
Normally, during a run of the mill correction, the indicator chart will drop down to the brown shaded, general support zone. When we see a bigger correction, the price action on the indicator chart will drop below the general support zone. When it does, you know you have a strong correction taking place, in the vertical yellow shaded areas.
Generally, I like to see the indicator chart trade back above the brown shaded general support zone for confirmation the correction is over. As with the daily indicator chart, I like to look for divergences at the lows.
Recall that we had a big correction in October of 2014 which looked like the end of the bull market was near, but markets rallied sharply out of that low. Now look at the indicator chart and our most recent correction into the August low. Here you can see the indicator chart at the top traded well below its October low of 2014 while the SPX made a higher low, which is positive divergence.
I could be wrong, but this chart tells me the SPX has a full tank of gas and can now rally up to new all-time highs. One last note on the chart below. The reason I only use this chart for finding important lows is because stock markets can stay overbought for a very long time, as shown by the indicator chart at the top.
Let's change gears now and look at the US dollar which had a big move last week. Below is the original daily chart I’ve been showing, which shows the blue falling wedge as the main consolidation pattern. You can see the red rising flag that formed right at the top of the March highs, which broke to the downside and that I was thinking would breakout topside. It ended up with 5 reversal points, so it’s now a bearish rising flag.
The US dollar still could be in backtest mode to the top blue rail of the falling wedge, which would come into play at the 96.50 area. That area would also be the top of the blue rectangle which should show strong support.
Often, when I see a failure such as the one showing above, I start to look for the original pattern to morph into a bigger pattern. The longer term daily chart, below, shows a potential large H&S consolidation pattern that maybe forming. The reason I think this could be a possibility is because of all the tops that come into play at the 97.50 area, which should produce some strong support.
We also have the 200 day moving average coming in at the 97.50 area as well, which should help with support. The bearish scenario would be if the US dollar breaks down to all the previous lows at the bottom of the trading range, which would then create a rectangle type of consolidation pattern.
The longer time frame one uses, the less damage seems to be done to the overall chart pattern.
Below is the very long term monthly candlestick chart for the US dollar, which is showing the major breakout of the massive base. At this point, the US dollar is showing us a black candlestick which isn’t what I want to see during a strong impulse move up, particularly with all the white candlesticks on the breakout move above the massive base. This month is still very young yet, so the last candlestick can still end up being white.
If we do close the month of December with a black candlestick, it will tell us the consolidation pattern is still building out.
The very long term 30-year monthly chart for the US dollar, below, shows the current price action as just a backtest to the top rail of the blue falling wedge and nothing more at this point in time. This is similar to the backtest to the top rail of the blue bullish rising wedge in the late 1990s.
Below is a long term monthly chart for the euro (XEU), which is showing it has broken down from a blue bear flag and is finding some support on the bottom dashed center line of a possible bear market downtrend channel. As the US dollar is looking for support on the top rail of its blue falling wedge, the euro is looking for a backtest to the underside of its blue bear flag.
Looking at the long term daily chart for oil we can see it’s building out a combo blue falling wedge/H&S consolidation pattern. So far, the backtest to the neckline has held resistance.
Below is a slightly different look at oil on the long term daily chart which is still bearish.
Below is a daily chart for natural gas which is showing it has broken down from a H&S consolidation pattern with a possible backtest to the 2.22 area.
This next chart is a combo chart which shows S&P/TSX Venture Composite (CDNX), the ARCA Gold BUGS Index (HUI), gold and silver. This chart has no chart patterns on it, just pure price action. I did put a support and resistance line at the low made back in November of 2014.
I don’t want to discourage anyone from taking any positions in the precious metals complex. That is not the point of this chart. This chart is merely to show you the price action and how close the PM complex is to its lows. Is the bear market over? Only time will tell.
Below is a daily line chart for gold which we’ve been following. It shows the rally last Friday took the price action back up to the daily closing price at the late July low, around 1085 or so. This is the very first obstacle gold will need to overcome to show that bulls are back in charge.
This last chart for today is a combo chart I posted a week or two ago, showing the big picture for the HUI and gold. As you can see, the bulls and the bears have been at each other for the last 2 1/2 years, with the bears having a slight advantage as both the HUI and gold have falling patterns in place. How many more reversal points will we see before these consolidation patterns are finished building out?
I have many more charts that I will show you this week in regards to the stock markets and the PM complex. There is a lot of interesting price action taking place in both sectors of the markets. However, the charts above should bring you up to speed for now.
Trading in financial instruments and/or cryptocurrencies involves high risks including the risk of losing some, or all, of your investment amount, and may not be suitable for all investors. Prices of cryptocurrencies are extremely volatile and may be affected by external factors such as financial, regulatory or political events. Trading on margin increases the financial risks.
Before deciding to trade in financial instrument or cryptocurrencies you should be fully informed of the risks and costs associated with trading the financial markets, carefully consider your investment objectives, level of experience, and risk appetite, and seek professional advice where needed.
Fusion Media would like to remind you that the data contained in this website is not necessarily real-time nor accurate. The data and prices on the website are not necessarily provided by any market or exchange, but may be provided by market makers, and so prices may not be accurate and may differ from the actual price at any given market, meaning prices are indicative and not appropriate for trading purposes. Fusion Media and any provider of the data contained in this website will not accept liability for any loss or damage as a result of your trading, or your reliance on the information contained within this website.
It is prohibited to use, store, reproduce, display, modify, transmit or distribute the data contained in this website without the explicit prior written permission of Fusion Media and/or the data provider. All intellectual property rights are reserved by the providers and/or the exchange providing the data contained in this website.
Fusion Media may be compensated by the advertisers that appear on the website, based on your interaction with the advertisements or advertisers.