Precious Metals Impulse Move: Are We Halfway Home?
David Tablish | Aug 10, 2015 04:50AM ET
In this report I’m going to update some charts we’ve been following very closely in the precious metal complex. I’m going to use the Market Vectors Gold Miners Fund (ARCA:GDX) as a proxy for the other PM stock indexes, asit shows volume.
All the PM stock indexes are basically showing the same patterns, which the combo triangle/H&S consolidation pattern as their last important consolidation pattern. There is also a very important—but yet uncompleted—bearish falling wedge that has been developing for the last three weeks. If there was ever a place for one of these types of patterns to form, we’re at that point right now. These patterns tend to show up in fast moving markets at about the halfway point in the impulse move.
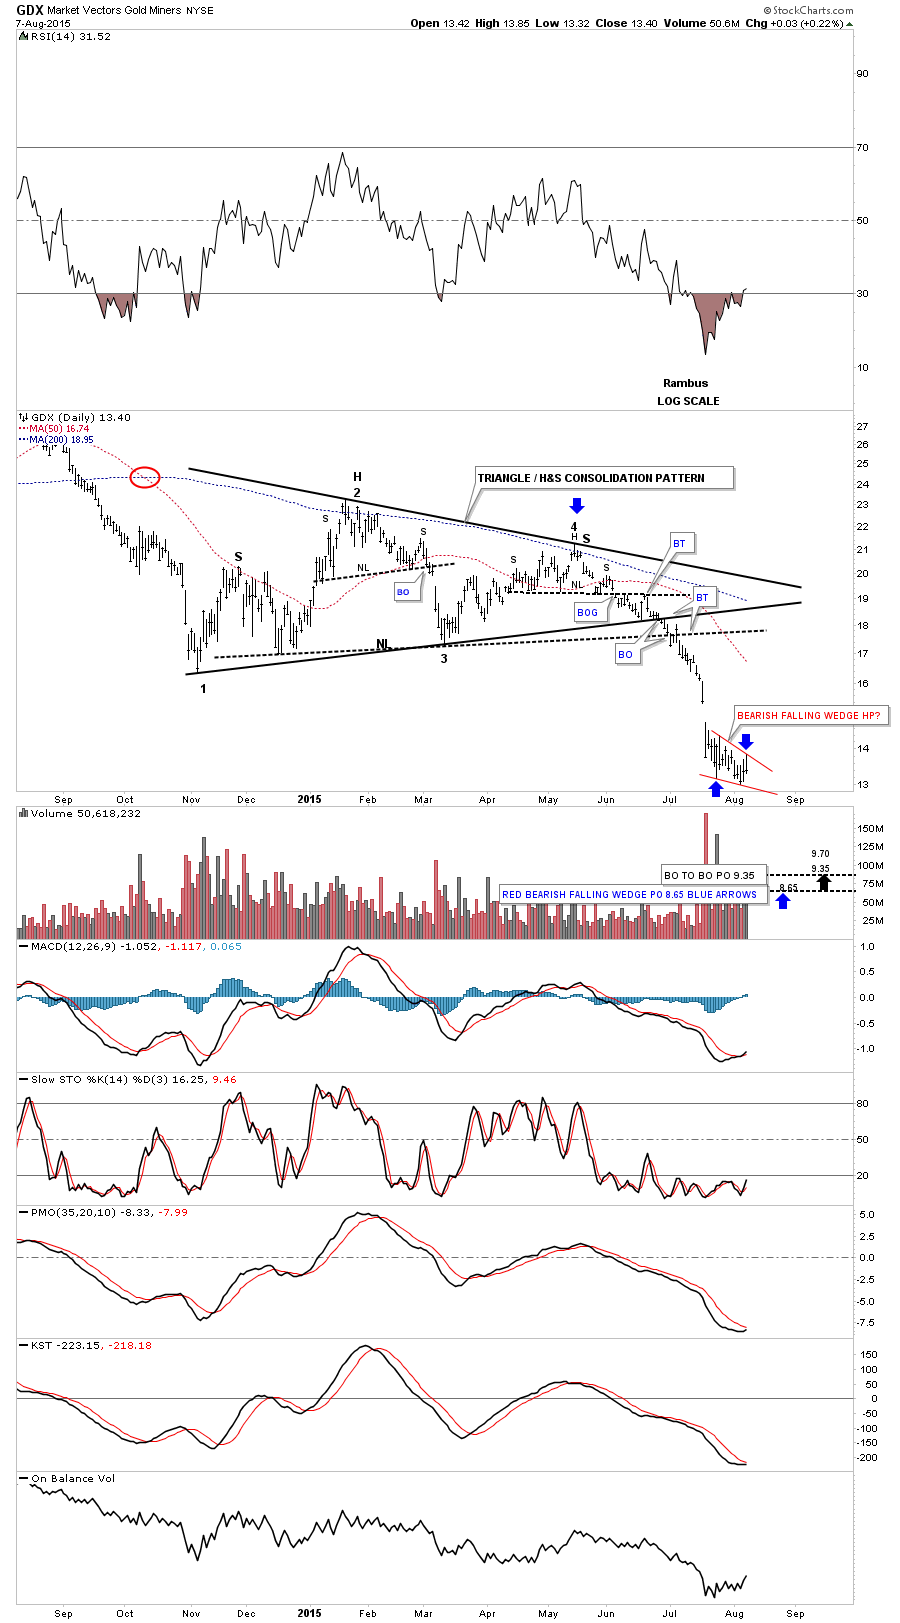
I’m going to just use the combo triangle/H&S consolidation pattern and the possible little red bearish falling wedge to look for a price objective. The daily chart below is a one year look at GDX which shows the all-important low that formed in November of last year.
I’ve always viewed that November low as the beginning of the consolidation pattern on GDX which ended at the end of June and the beginning of July. Using the little red, three-week, possible bearish falling wedge as a halfway pattern I get two price objectives based on the two different consolidation patterns.The breakout from the black triangle gives us a price objective down to the 9.35 area, while the breakout from the H&S consolidation pattern gives us a little higher price objective up at the 9.70 area.
There is one more price objective I can put on this daily chart, using the black triangle and the possible little red bearish falling wedge as a halfway pattern. The blue arrows show the impulse method, where I take the distance from the last reversal point in the black triangle and measure down to the first reversal point in the little red falling wedge.
I then take that measurement and add it to the last reversal point in the little red falling wedge which gives us a price objective a little deeper down to the 8.65 area. So, just based on these two consolidation patterns we may see some type of low between 8.65 and 9.35 or so.
Below is a long-term, daily chart that shows the previous impulse move down in 2014, which shows a little red triangle as a halfway pattern. As you can see, GDX failed to reach the price objective by about a point or so.
Price objectives give us a place to look for the impulse move to run out of gas or to start building out another consolidation pattern. Sometimes the price objectives can be dead on the money while other times they can be off a bit. The best way to benefitt from price objectives is to use them in conjunction with other TA such as support and resistance zones which allow you to paint a picture you can follow.
Now let's look at the long-term weekly chart to gain some perspective on where we’re at and how things may progress from here. This chart shows the two big topping patterns that led to massive declines once their necklines gave way.
For those that knew Chartology, these were money making opportunities. Back during the 2008 crash we didn’t have the 3X short ETFs for the precious metals complex. I used ProShares UltraShort Oil and Gas Fund (NYSE:DUG) and ProShares UltraShort Basic Materials (NYSE:SMN) which were 2X short ETFs to play that deflationary environment, at that time.
It was a magical ride since very few investors saw what was about to take place, and even fewer gold bugs had any idea what was about to happen. I was expecting a strong decline once the 2008 H&S top gave way, but I had no idea of the extent and magnitude of decline.
Now I believe we are at another important critical juncture as we’re now three weeks out of the bearish falling wedge. The breakout occurred on very heavy volume with a big breakout gap.
You can see three important trendlines that the GDX had to break in order to get to where it is right now. I’ve added two price objectives based on the two measuring techniques I use to give us a place to look for a low of some kind in the next several months or so.
The bottom line is, from the shorter term daily charts to the longer term weekly charts the seven and a half to the nine area on GDX may give us a good place to exit our current position in DUST.
Now let's look at Market Vectors Junior Gold Miners ETF (ARCA:GDXJ) which is set up just a little bit differently than the GDX. It to has two consolidation patterns: the bearish rising wedge at the top and a bearish falling wedge at the bottom.
Instead of the little red bearish falling wedge we looked at on the daily chart for the GDX, the GDXJ has built out a possible little red triangle consolidation pattern just below the bottom rail of the lower blue bearish falling wedge. I have shown many examples in the past when we see a smaller consolidation pattern form just above or just below an important trendline. And I've discussed how that little pattern can give the stock the energy it needs to really begin its impulse move, in this case down.
As you can see, both measurements come in just below 12 even though they’re taken from two totally different areas on the chart. In order to get the next impulse move going to the downside, the first thing we need to see happen is for the little red triangle consolidation pattern to break down. We’re close, but just not quite there yet.
Below is a long-term, weekly chart for the GDXJ that shows its massive H&S top and the two blue wedges that formed one on top of the other. Again, note the big breakout gap on heavy volume that accompanied the breakout of the lower bearish falling wedge.
Strictly from a Chartology perspective, that’s exactly what you want to see. Note the breakout and back-test that took place at the neckline and the bottom rail of the bearish rising wedge that took roughly four to six weeks to complete. This week will start the fourth week of the breaking out and back-testing sequence.
Below is another weekly look at the GDXJ which shows a possible bigger bearish falling wedge, similar to the one I showed earlier on the GDX chart. Unlike the GDX, GDXJ is doing a ping pong move at the moment—between the bottom rails of the two falling wedges. So far, from a Chartology perspective, nothing is broken yet that would call into question this possible scenario.
From a Chartology perspective, everything is still lined up for at least one more impulse move lower over the next month or two. It has been a long, four-year, bear market that may be coming to an end if these charts play out.
As always, there are no guarantees as to what the future holds. However, one thing I'm certain of is that I’ll be following the price action for clues on what is happening in this once-loved sector.
Trading in financial instruments and/or cryptocurrencies involves high risks including the risk of losing some, or all, of your investment amount, and may not be suitable for all investors. Prices of cryptocurrencies are extremely volatile and may be affected by external factors such as financial, regulatory or political events. Trading on margin increases the financial risks.
Before deciding to trade in financial instrument or cryptocurrencies you should be fully informed of the risks and costs associated with trading the financial markets, carefully consider your investment objectives, level of experience, and risk appetite, and seek professional advice where needed.
Fusion Media would like to remind you that the data contained in this website is not necessarily real-time nor accurate. The data and prices on the website are not necessarily provided by any market or exchange, but may be provided by market makers, and so prices may not be accurate and may differ from the actual price at any given market, meaning prices are indicative and not appropriate for trading purposes. Fusion Media and any provider of the data contained in this website will not accept liability for any loss or damage as a result of your trading, or your reliance on the information contained within this website.
It is prohibited to use, store, reproduce, display, modify, transmit or distribute the data contained in this website without the explicit prior written permission of Fusion Media and/or the data provider. All intellectual property rights are reserved by the providers and/or the exchange providing the data contained in this website.
Fusion Media may be compensated by the advertisers that appear on the website, based on your interaction with the advertisements or advertisers.