Watch The Financial Sector For The Next Topping Pattern
Chris Vermeulen | Apr 17, 2019 12:08AM ET
A very interesting price pattern is setting up in the financial sector that could lead to a very big move in the U.S. and Global markets. Remember how in 2008-09, the Financial sector and Insurance sector were some of the biggest hit stock sectors to prompt a global market crisis? Well, the next few weeks and months for the financial sector are setting up to be critical for our future expectations of the U.S. stock market and global economy.
Right now, many of the financial sector stocks are poised near an upper price channel that must be breached/broken before any further upside price advance can take place. The current trend has been bullish as prices have rallied off the December 2018 lows. Yet, we are acutely aware of the bigger price channels that could become critical to our future decision making. If there is any price weakness near these upper price channel levels and any downside price rotation, the downside potential for the price is massive and could lead to bigger concerns.
Let’s start off by taking a look at these Monthly charts:
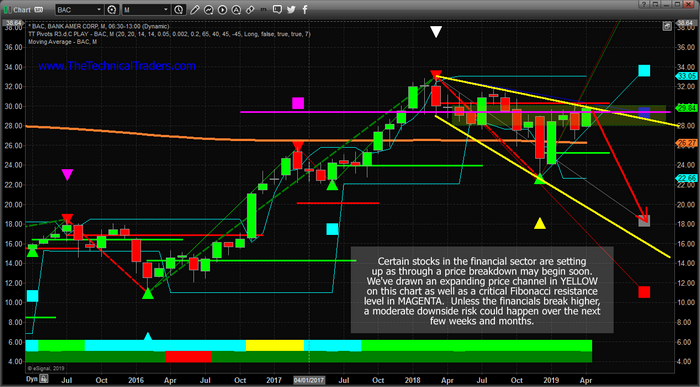
This first monthly Bank of America (NYSE:BAC) chart is best at showing the price channel (in YELLOW) as well as a key Fibonacci price level (highlighted by the MAGENTA line). We’ve also highlighted a price zone with a green shaded box that we believe is key support/resistance for the current price trend.
As you can see from this chart, since early February 2018, the overall trend has shifted into a sideways bearish trend. The price recovery from December 2018 was impressive, yes, but it is still rotating within this sideways/bearish price channel. Our belief is that this YELLOW upper price channel level MU.S.T be broken in order for the price to continue higher at this point. Any failure to accomplish this will result in a price reversal that could precipitate a 30% price decline in the value of BAC. In other words, “it is do-or-die time – again”.
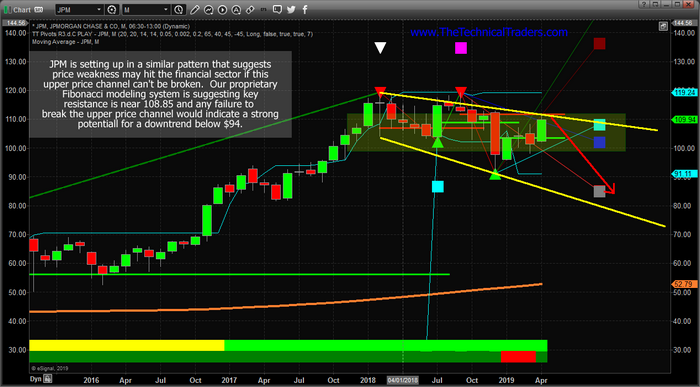
This monthly JPMorgan Chase (NYSE:JPM) chart, below, shows a similar pattern, yet the price channel is a bit more narrow visually. We have almost the same setup in JPM as we do in BAC. The same channels, the same type of Fibonacci price support level, the same type of sideways price support zone (the shaded box) and the same overall setup. As traders, we have to watch for these types of setup and be aware of the risks that could unfold with a collapse of the financial sector over the next few weeks.
We believe the next few weeks could be critical for the financial sector and for the overall markets. If weakness hits the financial sector as global growth continues to stagnate we could enter a period where the global perception of the future 12~24 months may change.
Right now, perception has been relatively optimistic in the global stock markets. Most traders have been optimistic that the markets will recover and a U.S./China trade deal will get settled. The biggest concern has been the EU and the growth of the European countries.
What if that suddenly changed?
We are not saying it will or that we know anything special about this setup. We are just suggesting that the monthly charts, above, are suggesting that price will either break above this upper price channel or fail to break this level and move lower. We are suggesting that, as skilled traders, we need to be acutely aware of the risks within the financial sector right now and prepare for either outcome.
This last chart, a weekly Direxion Daily Financial Bull 3X Shares ETF (NYSE:FAS) chart, shows a more detailed view of this same price rotation and sideways expanding wedge/channel formation. Pay very close attention to the shaded support channel shown with the GREEN BOX on this chart.
Any price rotation within this level should be considered “within a support channel” and not a real risk initially. We want to see price break above the upper price channel fairly quickly, within the next 2 to 5+ weeks, and we can to see it establish a new high (above $78 on this chart) to confirm a new bullish price trend. Once this happens, we’ll be watching for further price rotation and setups. If it fails to happen, then the RED DOWN ARROW is the most likely outcome given the current price setup.
Any downside price move in the Financial sector would have to be associated with some decreased future expectations by investors. Thus, our bigger concern is that something is lurking just below the surface right now that could pull the floor out from under this sector. Is it a surprise Fed rate increase? Is it some news from the EU? Is it a sudden increase in credit defaults? What is the “other shoe” – so to say.
Be prepared. If all goes well, then we’ll know within a few more weeks if the upside price rally will continue or if we need to start digging for clues as to why the support for the financial sector is eroding. This really is a “do or die” setup in the financial sector and we urge all traders to pay very close attention to this sector going forward. We believe it will be the leading sector for any major price weakness across the global markets.
Trading in financial instruments and/or cryptocurrencies involves high risks including the risk of losing some, or all, of your investment amount, and may not be suitable for all investors. Prices of cryptocurrencies are extremely volatile and may be affected by external factors such as financial, regulatory or political events. Trading on margin increases the financial risks.
Before deciding to trade in financial instrument or cryptocurrencies you should be fully informed of the risks and costs associated with trading the financial markets, carefully consider your investment objectives, level of experience, and risk appetite, and seek professional advice where needed.
Fusion Media would like to remind you that the data contained in this website is not necessarily real-time nor accurate. The data and prices on the website are not necessarily provided by any market or exchange, but may be provided by market makers, and so prices may not be accurate and may differ from the actual price at any given market, meaning prices are indicative and not appropriate for trading purposes. Fusion Media and any provider of the data contained in this website will not accept liability for any loss or damage as a result of your trading, or your reliance on the information contained within this website.
It is prohibited to use, store, reproduce, display, modify, transmit or distribute the data contained in this website without the explicit prior written permission of Fusion Media and/or the data provider. All intellectual property rights are reserved by the providers and/or the exchange providing the data contained in this website.
Fusion Media may be compensated by the advertisers that appear on the website, based on your interaction with the advertisements or advertisers.