Warning Signs Of A Top
Geoff Bysshe | Aug 30, 2020 05:44AM ET
The news of last week was the Fed’s announcement about their “updated monetary policy strategy.”
The big change was to suggest that they would let inflation overshoot their 2% goal in order to focus on an average inflation value.
I suppose I have to give them credit for very clearly letting us know what their thinking long before we’ll have to wonder what their thinking so we won’t have to be told that their not even thinking about what to do if inflation gets to the elusive nominal 2% goal.
Personally, I found it as helpful as hearing the President (any President) announce what he or she would do when the Federal government had a several years of budget surpluses.
The absurdity of the inflation debate is that we all know inflation is out of control.
For example, several times this week I heard from customers who wanted buy shares in TSLA and AAPL and simply couldn’t afford to buy a share because their prices were too inflated.
Fortunately, these great companies are attempting to keep inflation under control by reducing the price of their shares by 1/7 and ¼ respectively.
This will happen on Monday, so if you’re looking for TSLA or AAPL for a lower price than they were on Friday, Monday’s your day.
This leads me to how the Fed can easily reach its 2% inflation goal, and put its monetary stimulus efforts more in sync with the inflation targets its focused on.
The problem with current monetary policy isn’t that it is to slow to stimulate inflation. As I just pointed out, it’s been incredibly effective at inflating asset prices for well over a decade now.
The problem is that the S&P 500 isn’t a component of the CPI.
I haven’t done the math, but I’m pretty sure if the S&P 500 was included in the Fed’s inflation components we’d be able to hit 2%, and even average 2% as soon as they’d like.
With that problem solved let’s look at a more difficult one.
When will the SPY and QQQ pullback and when will IWM get its chance to trade at new highs?
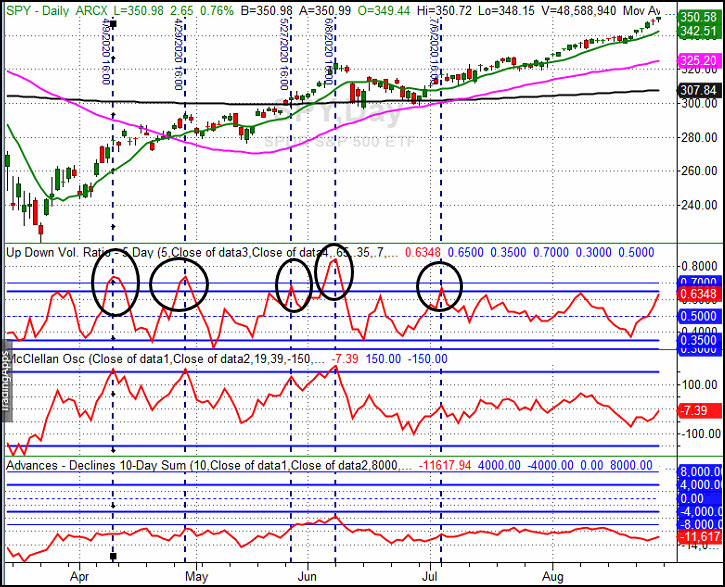
The SPY and QQQ have momentum that makes it very difficult to identify a short-term top, but there are a few indicators lining up that are worthy of your attention.
First, keep an eye on the 5-Day Up Down Volume Ratio. This is in the “internals” section of the Big View product. As you can see by the circled chart points below, when this indicator exceeds .70 and turns down, the market tends to consolidate or sell off.
In addition to the Up Down Volume, on Monday I’ll be looking at the intra-day trends of AAPL and TSLA on Monday to assess the mood of the market.
These two stocks will almost certainly be the headline de jour, and the direction they take relative to their Opening Range could serve as a good indicator for the market’s intra-day trend for the day.
On Monday, their stock splits take effect. Their prices will be lowered, and additional shares issued accordingly.
Both stocks have run up enormously since they announced the split on expectations that lower, post stock split, prices will attract new buyers and drive the share prices higher.
I don’t have a prediction about whether the actual split will induce even more buying, or it will mark a prominent day that will be later be described as, “buy the news, sell the split.”
However, I do have a plan to trade them and use them as a market indicator.
If they’re below their Opening Range (OR), stay away, and if the market is doing the same thing, be cautious. If they’re above their OR, look for the potential of a big trend day.
Best wishes for your trading,
Trading in financial instruments and/or cryptocurrencies involves high risks including the risk of losing some, or all, of your investment amount, and may not be suitable for all investors. Prices of cryptocurrencies are extremely volatile and may be affected by external factors such as financial, regulatory or political events. Trading on margin increases the financial risks.
Before deciding to trade in financial instrument or cryptocurrencies you should be fully informed of the risks and costs associated with trading the financial markets, carefully consider your investment objectives, level of experience, and risk appetite, and seek professional advice where needed.
Fusion Media would like to remind you that the data contained in this website is not necessarily real-time nor accurate. The data and prices on the website are not necessarily provided by any market or exchange, but may be provided by market makers, and so prices may not be accurate and may differ from the actual price at any given market, meaning prices are indicative and not appropriate for trading purposes. Fusion Media and any provider of the data contained in this website will not accept liability for any loss or damage as a result of your trading, or your reliance on the information contained within this website.
It is prohibited to use, store, reproduce, display, modify, transmit or distribute the data contained in this website without the explicit prior written permission of Fusion Media and/or the data provider. All intellectual property rights are reserved by the providers and/or the exchange providing the data contained in this website.
Fusion Media may be compensated by the advertisers that appear on the website, based on your interaction with the advertisements or advertisers.