Want To Know What A 90 Cent Eurodollar Looks Like? Well, This Is It!
Peter Brandt | Nov 07, 2014 12:09AM ET
[Note: Factor Trading is an advocate of classical charting principles. As a research and proprietary trading firm, we make no attempt to understand macro fundamental factors. We believe that geometric patterns on price graphs have the ability to reveal underlying price trends and can be useful for timing trade entry and defining risks.]
The Euro has been coiling within the boundaries of a symmetrical triangle since early 2008.
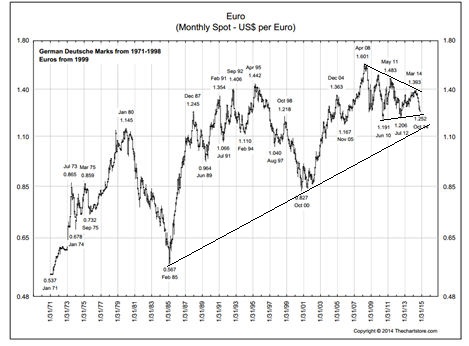
Symmetrical triangle top patterns require five contact points. This is exactly what the monthly chart displays. Remember, a pattern is not a pattern until it is completed. This triangle requires a decisive close below 1.2050 and then 1.1850 to confirm this chart interpretation and establish a target of 90 cents. No doubt most short-term traders believe the Euro is extremely oversold. I do not agree. Traders become conditioned by recent experiences — and the most recent experience of the Euro is a trading range from 1.2000 to 1.5000 or so. Yet, history tells a far different story than a range-bound Euro. The chart below shows the Euro dating back to the early 1970s (note – the chart is adjusted to use the D-Mark as a proxy for the Euro prior to 1999.) As this chart shows, the Euro is far from oversold. The decline from 1.4000 since May is not particularly spectacular from historic measures. However, a decline to 90 cents would be something special.
Remember, charts represent possibilities, not probabilities and definitely not predictions. The short side of the Euro must be consistent with the trading guidelines that you use. Even if this analysis is correct, the road to $1 or 90 cents will not be gentle. Expect great volatility as central bankers throughout the world attempt to sidestep the impact of this price decline. Expect gap openings due to interventions. The implications of a $1 or 90 cent Euro are significant. Disclosure: I am currently NOT short the Euro. I am, however, long USDSGD, long Dollar Index, short Canadian Dollars and short British Pounds. If I was smarter, I would be short the Euro. $ERO , #DRAGHIplb###
The information in this blog post represents my own opinions and does not contain a recommendation for any particular security or investment. I or my affiliates may hold positions or other interests in securities mentioned in the Blog, please see my Disclaimer page for my full disclaimer.
![]()
Trading in financial instruments and/or cryptocurrencies involves high risks including the risk of losing some, or all, of your investment amount, and may not be suitable for all investors. Prices of cryptocurrencies are extremely volatile and may be affected by external factors such as financial, regulatory or political events. Trading on margin increases the financial risks.
Before deciding to trade in financial instrument or cryptocurrencies you should be fully informed of the risks and costs associated with trading the financial markets, carefully consider your investment objectives, level of experience, and risk appetite, and seek professional advice where needed.
Fusion Media would like to remind you that the data contained in this website is not necessarily real-time nor accurate. The data and prices on the website are not necessarily provided by any market or exchange, but may be provided by market makers, and so prices may not be accurate and may differ from the actual price at any given market, meaning prices are indicative and not appropriate for trading purposes. Fusion Media and any provider of the data contained in this website will not accept liability for any loss or damage as a result of your trading, or your reliance on the information contained within this website.
It is prohibited to use, store, reproduce, display, modify, transmit or distribute the data contained in this website without the explicit prior written permission of Fusion Media and/or the data provider. All intellectual property rights are reserved by the providers and/or the exchange providing the data contained in this website.
Fusion Media may be compensated by the advertisers that appear on the website, based on your interaction with the advertisements or advertisers.