Wait A SEK…Did We See A Top In EUR/SEK?
Matthew Weller | Mar 03, 2015 02:03PM ET
For most of the last two years, the Swedish krona has been one of the worst-performing G10 currencies, even managing to weaken by over 15% against the embattled euro since bottoming in early 2013. The krona’s poor performance has been driven by a number of fundamental factors, prominently including consistent deflation and related easing from the Riksbank, but the technical picture may finally be starting to turn in favor of the SEK.
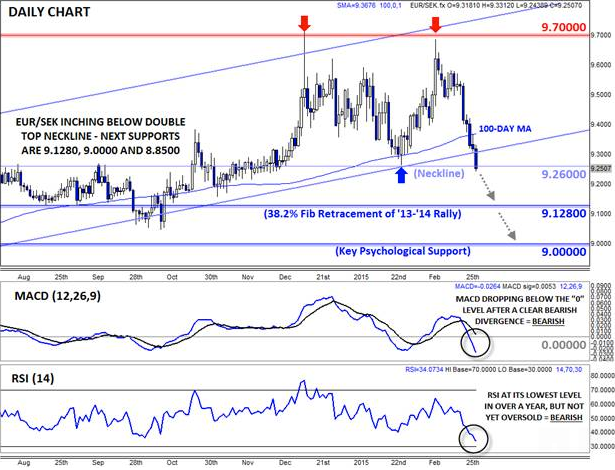
As the daily chart below shows, EUR/SEK ran into resistance at 9.70 in both mid-December and mid-February, and the pair has since dropped all the way down below the intervening low, or the “neckline” of the double top pattern at 9.26. It is notoriously difficult to identify effective double top patterns, but the secondary indicators further support the view that EUR/SEK may have carved out a significant medium-term top. Both the MACD and RSI indicators showed a clear bearish divergence at the recent highs, and both indicators have now dropped to their lowest levels in over a year. Combined with today’s drop through the bottom of the 2-year bullish channel, there is plenty of technical evidence that the EUR/SEK could weaken further in the coming weeks.
If EUR/SEK continues to drop, the next major level of support is the 38.2% Fibonacci retracement of the 2-year rally at 9.1280. A break below that potential floor could expose psychological support at 9.00 or even the double top measured move target down around 8.8500 later this year. As long as the pair stays below its bullish channel and 100-day MA around 9.35, the Swedish krona could finally enjoy its day in the day in the sun.
Source: FOREX.com
For more intraday analysis and market updates, follow us on twitter (@MWellerFX and @FOREXcom)
![]()
Trading in financial instruments and/or cryptocurrencies involves high risks including the risk of losing some, or all, of your investment amount, and may not be suitable for all investors. Prices of cryptocurrencies are extremely volatile and may be affected by external factors such as financial, regulatory or political events. Trading on margin increases the financial risks.
Before deciding to trade in financial instrument or cryptocurrencies you should be fully informed of the risks and costs associated with trading the financial markets, carefully consider your investment objectives, level of experience, and risk appetite, and seek professional advice where needed.
Fusion Media would like to remind you that the data contained in this website is not necessarily real-time nor accurate. The data and prices on the website are not necessarily provided by any market or exchange, but may be provided by market makers, and so prices may not be accurate and may differ from the actual price at any given market, meaning prices are indicative and not appropriate for trading purposes. Fusion Media and any provider of the data contained in this website will not accept liability for any loss or damage as a result of your trading, or your reliance on the information contained within this website.
It is prohibited to use, store, reproduce, display, modify, transmit or distribute the data contained in this website without the explicit prior written permission of Fusion Media and/or the data provider. All intellectual property rights are reserved by the providers and/or the exchange providing the data contained in this website.
Fusion Media may be compensated by the advertisers that appear on the website, based on your interaction with the advertisements or advertisers.