Volatility ETP Price Projection Service
Vance Harwood | Aug 28, 2018 01:07AM ET
I am offering a Volatility ETP Projection Service that calculates future volatility Exchange Traded Product (ETP) prices assuming the current VIX futures term structure is stable.
In my post Using the VIX Futures Term Structure to Predict Volatility ETP Prices, I show how this approach can be used to produce statistically valid ETP price projections and ranges.
This forecast does not attempt to predict upcoming volatility spikes or slumps—it’s totally focused on the price trends that would occur with a static VIX futures term structure.
With a stable term structure, the VIX futures prices that underlie the volatility ETPs like iPath S&P 500 VIX Short-Term Futures Exp 30 Jan 2019 (NYSE:VXX), iPath Series B S&P 500 VIX Short-Term Futures (NYSE:VXXB), ProShares Ultra VIX Short-Term Futures (NYSE:UVXY), and ProShares Short VIX Short-Term Futures (NYSE:SVXY) do change but they precisely follow the price/days-til-expiration curve. The VIX Central chart below shows the closing VIX futures prices for August 23, 2018. If the term structure is stable then the curve at the end of the 24th would have the identical price vs time shape but the blue data points, representing futures values, would all be shifted slightly down and to the left.
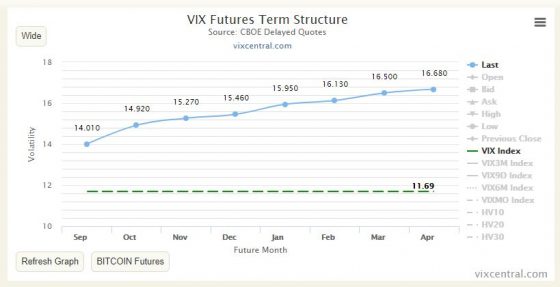
The VIX futures that underlie the volatility ETP are volatile creatures—tomorrow’s values can be dramatically different than today. I’m not trying to predict those sorts of changes. What I am computing is the decay or boost that the volatility ETPs experience if the term structure stays in a stable contango or backwardation configuration. This calculation is not an easy problem—there are a lot of moving parts even when the market is stable.
Historically the VIX futures term structure has been in a contango configuration 80%+ of the time. Contango fuels a situation where the long volatility ETPs like VXX, UVXY, or VelocityShares Daily 2x VIX Short Term linked to SP 500 VIX Short Fut Exp 4 Dec 2030 (NASDAQ:TVIX) suffer from high decay factors. Anyone that’s looked at their long-term charts will see the massive impact of those decays over the long run.
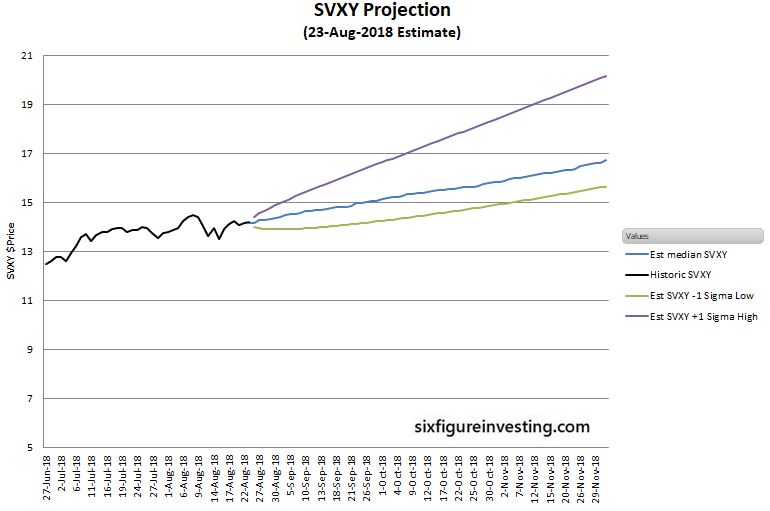
Because of the typical decay in long volatility products, short volatility trades are popular but the possibility of volatility spikes makes risk management an important concern. By estimating median prices and +-1 sigma ranges traders have some analytical results that can help quantify payoffs and establish appropriate risk management thresholds.
The chart below shows a typical SVXY projection when the term structure has been in contango for a while.
The next chart shows what the VXX projection would have looked like on November 28, 2017, compared to the actual path of VXX after that.
The chart below shows histograms of percent differences between the actual results and 21 trading day median forecasts for May 2004 through January 2018.
The median error is within a few percent for all the ETPs. The relatively wide error distributions, especially on the high side for the long volatilty funds, reflects the impact of volatility slumps and spikes. For more on the statistical characteristics of these projections please see Using the VIX Futures Term Structure to Predict Volatility ETP Prices.
The Product
- The product is an online spreadsheet delivered via Google’s free web-based office suite.
- Currently, this link is a live, read-only version of the spreadsheet. Starting 1-September-2018 the link will be a static, read-only snapshot of the spreadsheet.
- None of the important formulas used to compute the projections will be visible; the information in the spreadsheet is essentially values only.
- Currently, SVXY, VXX/VXXB, and UVXY tickers are available with TVIX being a planned addition. Please let me know if you are interested in other tickers (e.g, VMIN, ZIV, VXZ)
Key Specifications
- Median Price Projections
- Projected median prices for the next 70 trading days based on recent VIX futures prices (quotes are delayed 20 minutes or more). If the market is closed the most recent regular market closing prices are used. You should expect the actual prices to end up above or below that projected value at about the same 50% rate.
- For example, if the median SVXY projection for 21 trading days from now is $15/share then statistically you should expect the actual SVXY value when that day arrives to be a coin flip, 50% of the time above and 50% below.
- Historically the standard deviation of percentage errors between the ETP projection value and the actual 21 trading day value has been 8.9%, so statistically, you should expect the forecast value error to be +-8.9% or more 32% of the time.
- One Sigma High/Low Range Projections
- Projected high/low one sigma price ranges for the next 70 trading days are based on the last 40 days of historic prices for the respective ETPs.
- Theoretically, you can expect the actual prices to close below the high range around 84% of the time and below the low range around 16% of the time.
- For example, if the realized volatility of SVXY for the last 40 days has been running at a 24% annualized rate and the current value of SVXY is $15 statistically you should expect the actual SVXY value 21 trading days after the estimate to be above $16.07 or below $14 around 32% of the time.
Disclaimers
- This service does NOT predict the future! It only projects what the ETP prices would do given current VIX futures prices and a static VIX futures term structure. It is a very safe assumption that the VIX futures term structure will NOT stay static.
- This spreadsheet does not attempt to predict volatility spikes or slumps—it’s only concerned with computing the impact of a stable VIX futures term structure on volatility ETP prices. Oftentimes volatility spikes & slumps will move prices well away from the projections.
- The input information I use (e.g., VIX, VIX futures prices) is delayed by an indeterminate amount of time (usually at least 20 minutes) and may be inaccurate or incorrect—especially during times of market stress. Obviously, if the input information is wrong my projections will be useless.
- High/low range projections are based on historic ETP volatility and growth factors, they do not incorporate information from the VIX futures term structure
Trading in financial instruments and/or cryptocurrencies involves high risks including the risk of losing some, or all, of your investment amount, and may not be suitable for all investors. Prices of cryptocurrencies are extremely volatile and may be affected by external factors such as financial, regulatory or political events. Trading on margin increases the financial risks.
Before deciding to trade in financial instrument or cryptocurrencies you should be fully informed of the risks and costs associated with trading the financial markets, carefully consider your investment objectives, level of experience, and risk appetite, and seek professional advice where needed.
Fusion Media would like to remind you that the data contained in this website is not necessarily real-time nor accurate. The data and prices on the website are not necessarily provided by any market or exchange, but may be provided by market makers, and so prices may not be accurate and may differ from the actual price at any given market, meaning prices are indicative and not appropriate for trading purposes. Fusion Media and any provider of the data contained in this website will not accept liability for any loss or damage as a result of your trading, or your reliance on the information contained within this website.
It is prohibited to use, store, reproduce, display, modify, transmit or distribute the data contained in this website without the explicit prior written permission of Fusion Media and/or the data provider. All intellectual property rights are reserved by the providers and/or the exchange providing the data contained in this website.
Fusion Media may be compensated by the advertisers that appear on the website, based on your interaction with the advertisements or advertisers.