Using The VIX Futures Term Structure To Predict Volatility ETP Prices
Vance Harwood | Aug 28, 2018 01:13AM ET
Status quo forecasting is sometimes very easy to do. For example, if you predict that tomorrow’s high temperature will be the same as today’s high, your estimate will be close to the actual high much of the time. Predicting volatility Exchange Traded Products (ETP) prices is not so straightforward.
The VIX futures that volatility ETPs like iPath S&P 500 VIX Short-Term Futures Exp 30 Jan 2019 (NYSE:VXX), ProShares Short VIX Short-Term Futures (NYSE:SVXY), ProShares Ultra VIX Short-Term Futures (NYSE:UVXY), and VelocityShares Daily 2x VIX Short Term linked to SP 500 VIX Short Fut Exp 4 Dec 2030 (NASDAQ:TVIX) track are similar to stock options in that they have a time value that usually decaying. Generally the longer the VIX future has until expiration the higher its price. If you plot VIX futures prices versus time until expiration the chart often looks like the one below from VIX Central . This curve is called the VIX Futures Term Structure.
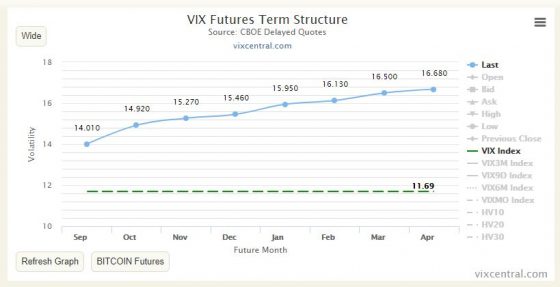
The term structure curve can be relatively stable for significant periods of time—which raises the question of whether we can use the term structure to predict volatility ETP prices.
Even if the price vs time curve of the VIX Futures stays exactly the same, several underlying factors that impact the prices of the volatility ETPs are in a state of change. For example:
- The individual VIX future’s prices change as they approach expiration
- The mix of VIX futures that determines the ETP values changes based on their time to expiration and their prices
- The position size of VIX Futures held by the leveraged ETPs (e.g., TVIX, UVXY, SVXY, Rex VolMAXX Short Vix Weekly Futures Strategy (NYSE:VMIN), VelocityShares Daily Inverse VIX Medium Term (NASDAQ:ZIV)) changes on a daily basis based on the previous day’s percentage moves
Assuming the VIX futures term structure is stable allows us to project how much decay/gain is “built-in” to the prices of the long/inverse volatility ETPs. This information can help us set strike prices for option strategies, set limit prices, and determine risk/reward parameters. More than 80% of the time, the VIX Future Term Structure is in a configuration called contango , where futures with more time until expiration are priced higher than the “spot” VIX price. While in contango, decay factors on long volatility funds like VXX, UVXY, and TVIX can be considerable as can the boost factors on inverse funds like SVXY, VMIN, and ZIV.
Obviously, none of these projections are deterministic—all it takes is a tweet to turn any projection based on yesterday’s data into a source of amusement. But despite volatility’s volatile nature, it turns out that the term structure is stable enough to enable the creation of estimates with sound statistical characteristics.
I developed algorithms to project ETP prices forward 70 trading days assuming the current term structure is stable. A stable term structure has a static price/time curve but the constituent VIX futures prices do not stay the same—they trace the curve as the futures’ prices converge to the VIX price at expiration. These price projections should be viewed as a median estimate of future prices; statistically, you can expect around 50% of the actual values to be higher and 50% to be lower.
I have also estimated the upper and lower 1 sigma ranges for the ETPs. For those projections, I used the volatility and growth factors from the ETP’s previous 40 trading days to compute future ETP prices ranges. With the one sigma high and low ranges, you can expect that approximately 16% of the time the actual prices will exceed the high range prediction and 16% of the time they will be lower than the low range.
In addition to the median and one sigma range projections, I’ve also displayed the actual close prices for the previous 40 trading days.
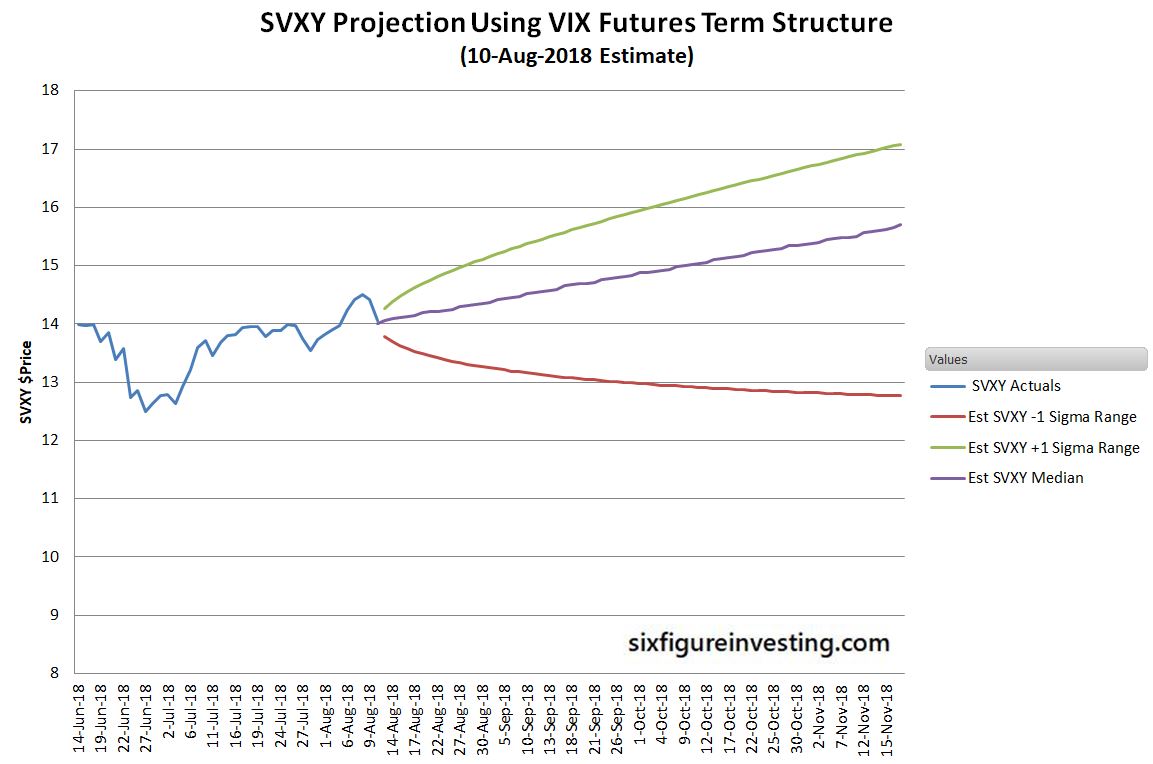
The August 10, 2018 projections of ProShares’ -0.5X leverage SVXY median and plus/minus one sigma ranges for the next 70 trading days are shown below.
To verify my algorithms I compared the projections with the actual results. The example below shows the projection for VXX based on the term structure on November 28th, 2017. The black line shows the price history.
In the chart above the median line is closer to the minus 1 sigma line than you’d expect. The high/low +-1 sigma lines are based on VXX’s behavior in the previous 40 trading days whereas the median line reflects the term structure. In this case, 28-Nov-2018 was the beginning of a period of increased contango but the +-1 sigma ranges were reflecting the behavior of the last 40 days.
The chart above illustrates three things about the ETP projection model:
- At times, when the term structure cooperates, the model is quite accurate. The 9-Jan-2018 median estimate ($25.8), which was 28 trading days from the estimation date was within 2% of VXX’s actual $26.28 close value.
- The model did not predict the February 5, 2018 volatility spike that resulted in VXX more than doubling from its January 2018 lows
- The rapid rise in VXX’s actual values from median levels to crossing the plus one sigma range on the 29th of January would have been an indication to those short volatility that their risk was climbing significantly.
Since the median projection is based on the current VIX futures term structure it will react quickly to breaking events. The inherent averaging in the historic data used to project the upper and lower one sigma range projections dampens their reaction to recent price moves.
To validate my algorithms overall I generated the statistics on the median and +-1 sigma points since 2004 (using simulated ETP data when historic values are not available). Actual values should end up below the plus one sigma threshold around 84% of the time, below the median threshold around 50% of the time, and below the minus sigma threshold around 16% of the time. The table below shows the composite 21 trading-day statistics for the period of May 2004 through January 2018.
Event Statistics for 21 trading-day ETP Price Projections vs Actual Results
Given the wide diversity of market conditions from 2004 through 2018, I think these results are quite good. SVXY’s -1 sigma projections are approximately 5% high (more actual prices below the prediction than expected) and the long volatility VXX/UVXY upper projections are around 5% low. That effect might be from volatility’s tendency to have spikes up that are significantly more dramatic than volatility slumps.
I also investigated how these statistics varied over time/during different market regimes. The chart below shows the one-year rolling average statistics for the 21 trading day projection.
In actuality, the term structure can change in many ways. Typical changes include shifts concentrated in the front months (soonest to expire) with big increases if fear is increasing or big drops if fear has turned to greed. In addition, the entire term structure can shift up or down as a whole depending on market conditions. Any significant shape change or level shift has a big impact on the projected ETP prices.
In summary, my analysis shows that predicting median volatility ETP prices assuming that the VIX future’s term structure is stable is a statistically reasonable method. Volatility ETPs are always going to be volatile but the term structure is stable enough that it can reasonably be used to predict the average effects of contango and backwardation.
Trading in financial instruments and/or cryptocurrencies involves high risks including the risk of losing some, or all, of your investment amount, and may not be suitable for all investors. Prices of cryptocurrencies are extremely volatile and may be affected by external factors such as financial, regulatory or political events. Trading on margin increases the financial risks.
Before deciding to trade in financial instrument or cryptocurrencies you should be fully informed of the risks and costs associated with trading the financial markets, carefully consider your investment objectives, level of experience, and risk appetite, and seek professional advice where needed.
Fusion Media would like to remind you that the data contained in this website is not necessarily real-time nor accurate. The data and prices on the website are not necessarily provided by any market or exchange, but may be provided by market makers, and so prices may not be accurate and may differ from the actual price at any given market, meaning prices are indicative and not appropriate for trading purposes. Fusion Media and any provider of the data contained in this website will not accept liability for any loss or damage as a result of your trading, or your reliance on the information contained within this website.
It is prohibited to use, store, reproduce, display, modify, transmit or distribute the data contained in this website without the explicit prior written permission of Fusion Media and/or the data provider. All intellectual property rights are reserved by the providers and/or the exchange providing the data contained in this website.
Fusion Media may be compensated by the advertisers that appear on the website, based on your interaction with the advertisements or advertisers.