USD/JPY With A Bearish Potential
Alpari Research & Analysis | Jul 17, 2017 09:17AM ET
Selling USD now seems obvious. On the other hand, buying in the same time JPY does not sound like a good idea. We do have a positive sentiment on stocks, traders are good with the risk and are escaping from save heaven assets. So why the idea behind this analysis is to look negatively on the USD/JPY? We will try to explain that using the best tools from the technical analysis.
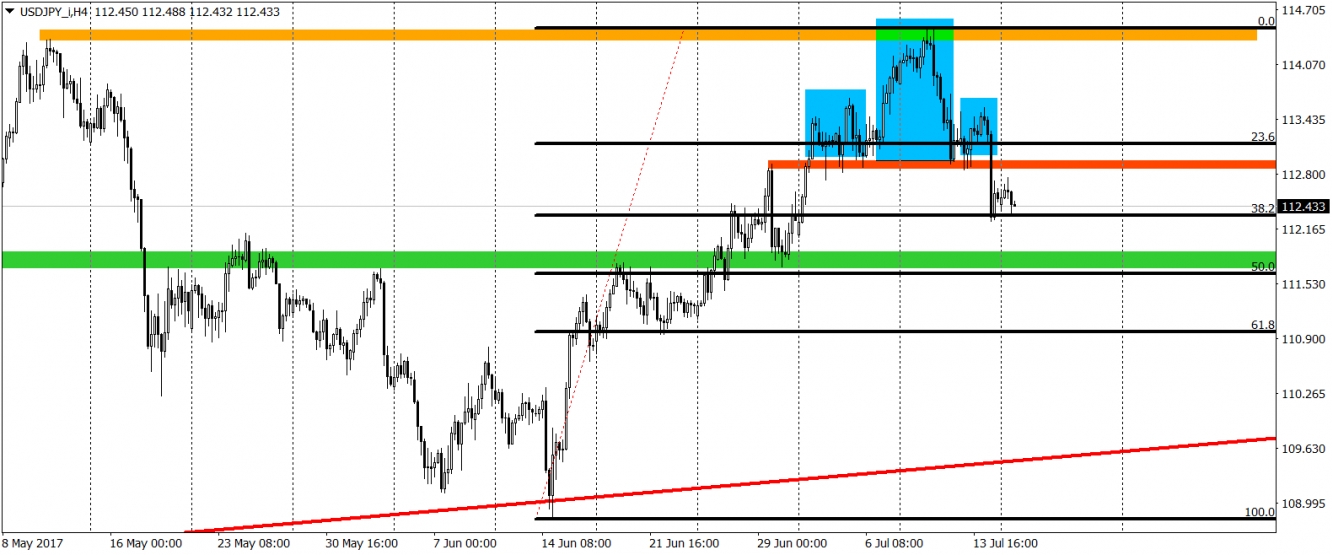
First of all we do have a nice reversal pattern here, head and shoulder (blue lines). Formation is active as the neckline was already broken (red). The potential target for this movement is the green area, which in my opinion can be a strong support. Why do I think that? Well just look on the chart since the beginning of February and you will see that this area was used as a S/R multiple times. The only obstacle here now is the 38,2% Fibonacci level (current local support) but I think that the gravity will do the job here and the price will decline 60-70 pips lower.
What will happen after that depends from the price action on this level. Generally I would not be surprised if we would touch the red line which is a long-term dynamic support connecting higher lows from April and June. But for that we still do have a lot of time and I would love to see more pessimistic arguments on the chart before going full bear.

Trading in financial instruments and/or cryptocurrencies involves high risks including the risk of losing some, or all, of your investment amount, and may not be suitable for all investors. Prices of cryptocurrencies are extremely volatile and may be affected by external factors such as financial, regulatory or political events. Trading on margin increases the financial risks.
Before deciding to trade in financial instrument or cryptocurrencies you should be fully informed of the risks and costs associated with trading the financial markets, carefully consider your investment objectives, level of experience, and risk appetite, and seek professional advice where needed.
Fusion Media would like to remind you that the data contained in this website is not necessarily real-time nor accurate. The data and prices on the website are not necessarily provided by any market or exchange, but may be provided by market makers, and so prices may not be accurate and may differ from the actual price at any given market, meaning prices are indicative and not appropriate for trading purposes. Fusion Media and any provider of the data contained in this website will not accept liability for any loss or damage as a result of your trading, or your reliance on the information contained within this website.
It is prohibited to use, store, reproduce, display, modify, transmit or distribute the data contained in this website without the explicit prior written permission of Fusion Media and/or the data provider. All intellectual property rights are reserved by the providers and/or the exchange providing the data contained in this website.
Fusion Media may be compensated by the advertisers that appear on the website, based on your interaction with the advertisements or advertisers.