USD/JPY Lacks Direction With Buyers Defending Key Support Zones
MarketPulse | Jun 10, 2025 02:44AM ET
USD/JPY, a historically volatile forex pair, has failed to break lows and has been consolidating at the low of its 2024 to today’s monthly range.
Looking at higher timeframes allows us to see where prices currently stand and zones of interest as the Federal Reserve and Bank of Japan’s Monetary policies diverge once again.
From Monthly to Daily charts, we will look at zones of interest in potential breakouts or reversals.
USD/JPY Higher Timeframe Analysis
USD/JPY Monthly Chart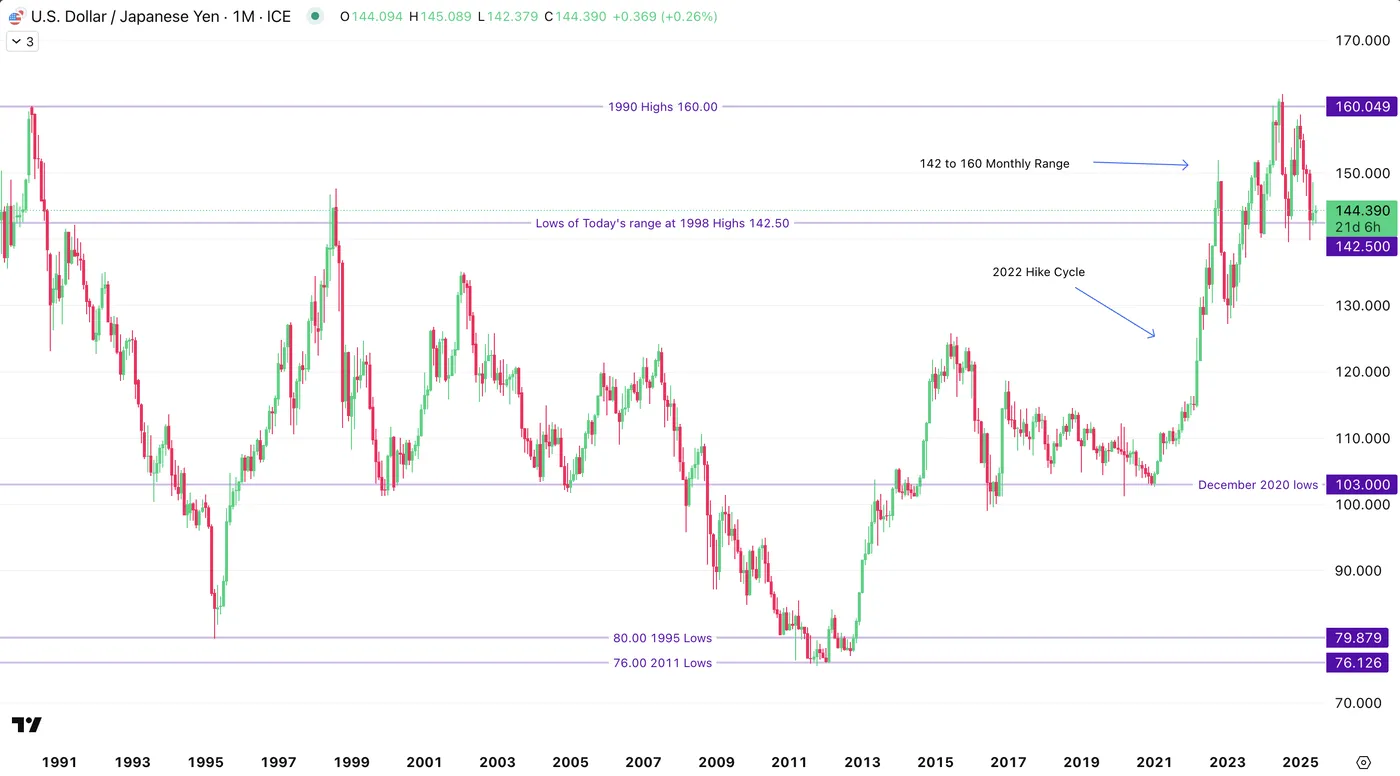
Source: TradingView
USD/JPY has been consolidating in a broad range between 140.00 and 160.00 over the past year, following the end of the Federal Reserve’s rate hike cycle.
That hike cycle had previously fueled a sharp rally in the pair, lifting it from 103.00 in December 2020—when U.S. rates were near zero—to a peak of 161.95 in July 2024.
Those levels hadn’t been seen since the 1990s, when Japan’s economic boom culminated in the infamous financial bubble. In response, the Bank of Japan sharply raised rates, triggering a dramatic move in USD/JPY from similar highs down to 80.00, as the country entered what became known as the “Lost Decade.”
USD/JPY Weekly Chart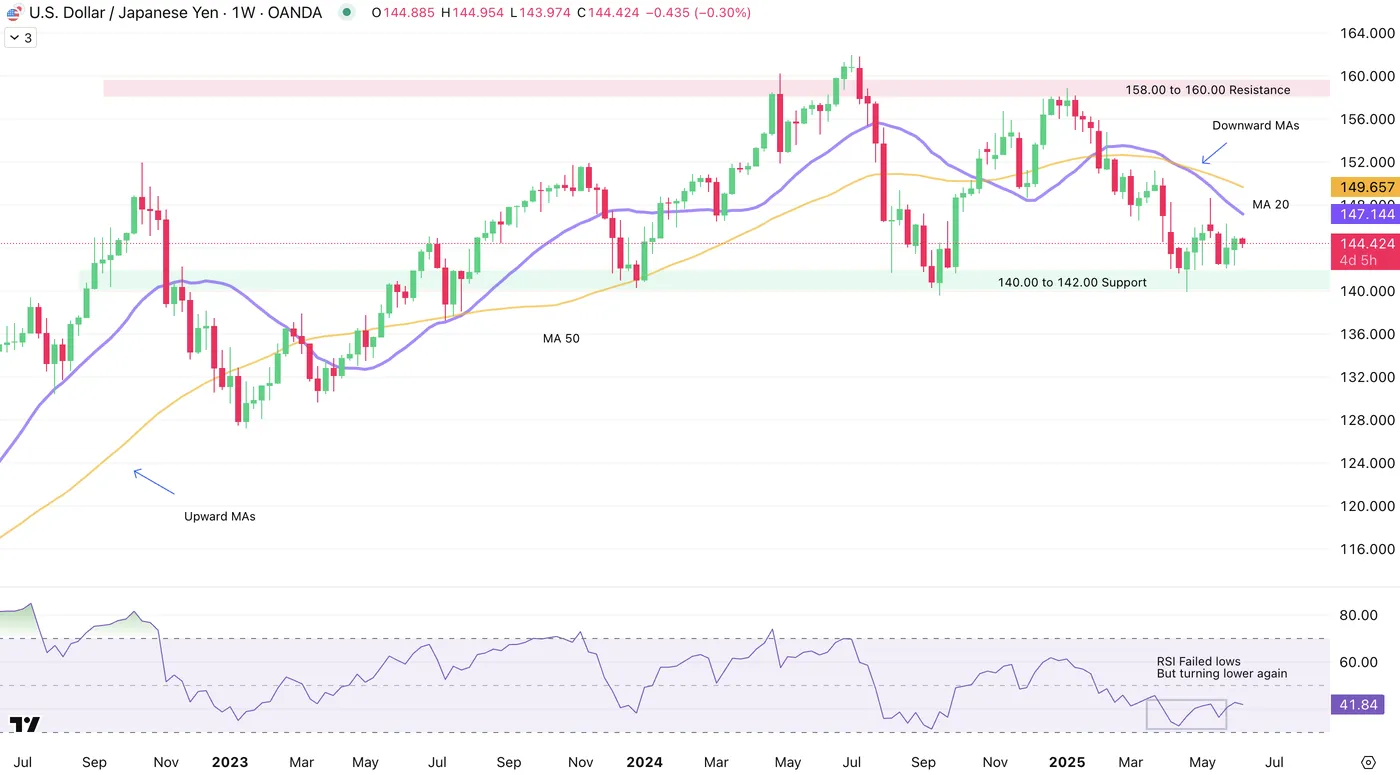
Source: TradingView
Prices are still contained in the 140.00 to 160.00 Monthly range, although since 2025, prices have been trending down towards the lower part of the range.
The weekly 20 MA crossed the MA 50 in a less intense version of a Death Cross, and both key moving averages are now sloping down.
Prices had stalled in April with the peak of tariff fear after the Liberation Day speech from US President Trump - And a failed low on the Weekly RSI didn't help to continue the descent in the prices.
The RSI is starting to turn down again, though we will see a couple hurdles in the Daily chart right after.
Higher inflation outlooks due to tariffs are putting the FED in a tough situation to cut rates. BoJ-FED interest rate differentials still add fundamental support to the USD/JPY Outlook, something to check for the upcoming months.
A slowdown of US economic activity and a higher Japanese inflation may just contribute to an ever-different monetary policy between the two central banks.
USD/JPY Daily Chart
Source: TradingView
Prices had volatile swings in the beginning of May 2025, going from 142 to 149 before reversing back towards the 142.00 support zone.
RSI is back to neutral and the Daily 20 and 50 MAs are right below today's prices, which buyers might use as immediate support.
Prices bounced decently in the past two sessions with USD recovery some strength, though prices are locked in a 142 to 145 smaller range, and except for a particularly strong comeback in the Greenback, I don't see any fundamental reason for a major correction towards May highs.
Keep in check any particular move to safe-haven currencies and commodities where the Yen could appreciate, and if nothing changes on the geopolitical landscape, the 142 to 145 range seems like a solid base for trading.
There is a potential resistance to a breakout to the upside at 146.54 that also coincides with the Weekly MA 20.
On a move down from the highs of the current range, look towards the 142.30 lows, and 140.00 for further continuation.
Safe Trades!
Trading in financial instruments and/or cryptocurrencies involves high risks including the risk of losing some, or all, of your investment amount, and may not be suitable for all investors. Prices of cryptocurrencies are extremely volatile and may be affected by external factors such as financial, regulatory or political events. Trading on margin increases the financial risks.
Before deciding to trade in financial instrument or cryptocurrencies you should be fully informed of the risks and costs associated with trading the financial markets, carefully consider your investment objectives, level of experience, and risk appetite, and seek professional advice where needed.
Fusion Media would like to remind you that the data contained in this website is not necessarily real-time nor accurate. The data and prices on the website are not necessarily provided by any market or exchange, but may be provided by market makers, and so prices may not be accurate and may differ from the actual price at any given market, meaning prices are indicative and not appropriate for trading purposes. Fusion Media and any provider of the data contained in this website will not accept liability for any loss or damage as a result of your trading, or your reliance on the information contained within this website.
It is prohibited to use, store, reproduce, display, modify, transmit or distribute the data contained in this website without the explicit prior written permission of Fusion Media and/or the data provider. All intellectual property rights are reserved by the providers and/or the exchange providing the data contained in this website.
Fusion Media may be compensated by the advertisers that appear on the website, based on your interaction with the advertisements or advertisers.