USD/CAD Bears Pause For Breath Below Resistance
Faraday Research | Apr 16, 2018 05:28AM ET
In a previous post, we highlighted the tendency for USD/CAD to trade lower throughout April using a 10 year seasonal chart. Just over half way through the month and already 2.2% lower, it appears on track to maintain this pattern.

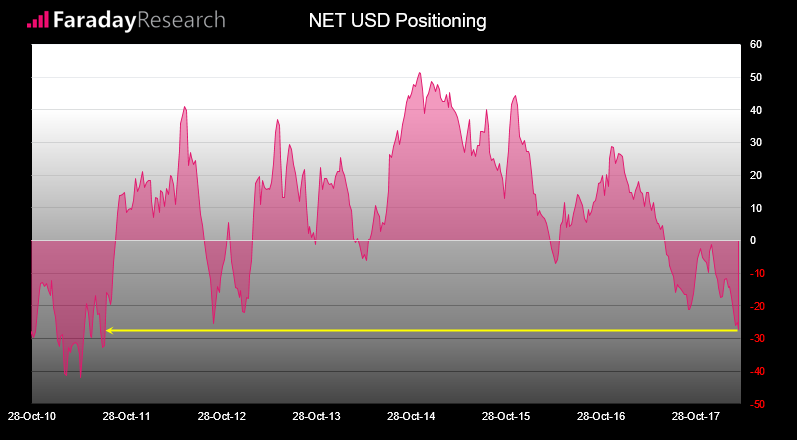
Also helping its cause is the fact that, as of last Tuesday at least, markets were net short the USD at levels not seen since 2011. Whilst it raises the potential that short USD could become an overcrowded trade, it at least demonstrates the bearish sentiment towards the Greenback now. Couple this with USD/CAD’s bearish seasonal pattern and technical analysis, we could be sat on a high probability setup for a short.
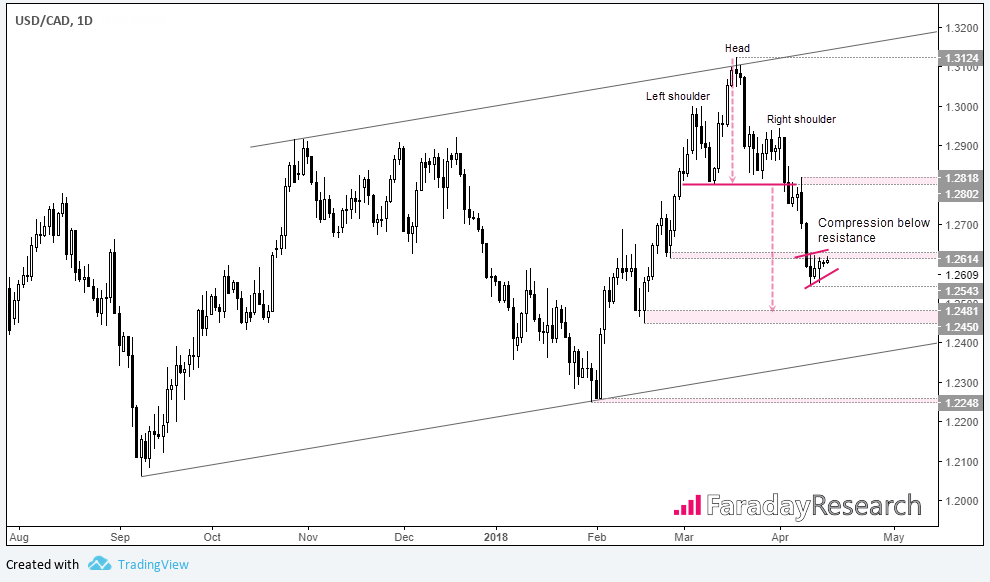
The head and shoulders pattern on USD/CAD’s daily chart is not too far from hitting its initial target. If we project the target using the 1.3124 head and 1.2800 as the neckline, the target lands near the 1.2450 lows. Being a key structural level it makes the area a viable target for bears, but that’s not to say we an eventual break beneath is out of the question either.

Momentum on the daily chart has been predominantly bearish since the 1.3124 high, and retracements have been minor between three clear phases of bearish range expansion. Now compressing near recent lows, we’re seeking a break of the 1.2543 low before entering. If momentum decides to break above 1.2629 (above recent compression candles), we’d prefer to step aside until bearish momentum returns.
However we also note it remains within a wide bullish channel. Although its bullish trajectory is hardly setting the world alight, the lower channel could provide support so is a worthy technical area to monitor as price action develops.
The Bank of Canada hold their monetary policy meeting on Wednesday. Whist the consensus expects them to hold, any hawkish clues for their next hike could see CAD crosses broadly strengthen. And if such clues are not apparent, CAD crosses could just as easily sell-off too. So be on the lookout for bouts of volatility surrounding the meeting but, if the technical picture allows for a short, let price action be your guide
Original Post
Trading in financial instruments and/or cryptocurrencies involves high risks including the risk of losing some, or all, of your investment amount, and may not be suitable for all investors. Prices of cryptocurrencies are extremely volatile and may be affected by external factors such as financial, regulatory or political events. Trading on margin increases the financial risks.
Before deciding to trade in financial instrument or cryptocurrencies you should be fully informed of the risks and costs associated with trading the financial markets, carefully consider your investment objectives, level of experience, and risk appetite, and seek professional advice where needed.
Fusion Media would like to remind you that the data contained in this website is not necessarily real-time nor accurate. The data and prices on the website are not necessarily provided by any market or exchange, but may be provided by market makers, and so prices may not be accurate and may differ from the actual price at any given market, meaning prices are indicative and not appropriate for trading purposes. Fusion Media and any provider of the data contained in this website will not accept liability for any loss or damage as a result of your trading, or your reliance on the information contained within this website.
It is prohibited to use, store, reproduce, display, modify, transmit or distribute the data contained in this website without the explicit prior written permission of Fusion Media and/or the data provider. All intellectual property rights are reserved by the providers and/or the exchange providing the data contained in this website.
Fusion Media may be compensated by the advertisers that appear on the website, based on your interaction with the advertisements or advertisers.