USD/CHF 2 Year Chart Shows Continued Acceleration
eFXnews | Sep 15, 2014 07:38AM ET
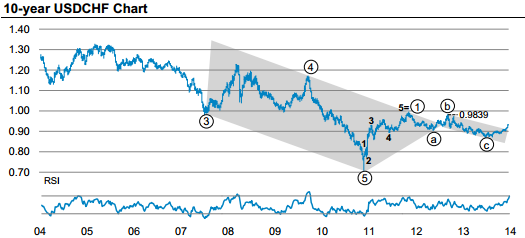
On the 10-year chart:
"USD/CHF completed a major 5-wave sequence that began in 2000, reaching a low of 0.7071. USD/CHF broke out of the historical trend channel in mid-2012 and has since been trading within another smaller channel. We recently wrote about how breaking the 0.91 level was key for our bullish USDCHF view. Having now broken this level, we would use any setbacks to enter long positions," MS projects.
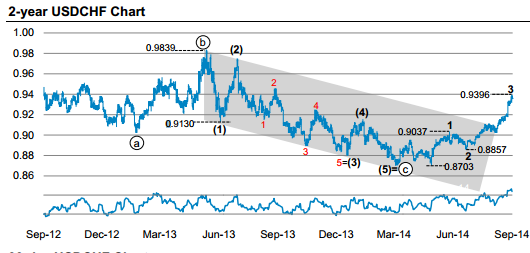
On the 2-year chart:
"Having broken out of the upper end of the trend channel around 0.91, USD/CHF has continued to accelerate. If the 0.9396 level was a high, then the 3 rd wave would have completed and USD/CHF would retrace. We look for a tretracement down to the 0.9150 area, where we would buy again. Over the longer term we would expect USD/CHF to exceed the b - wave top at 0.9839," MS adds.
On the 90-day chart:
"In the short term, should 0.9396 be the high, USD/CHF could retrace the 3 rd -wave. The 38.2% retracement is at 0.9190 and the 50% at 0.9126. We recommend long USD/CHF positions from this area. The risk would be a move below the 2-wave bottom at 0.8857. Our fundamental view also supports this trade," MS advises.
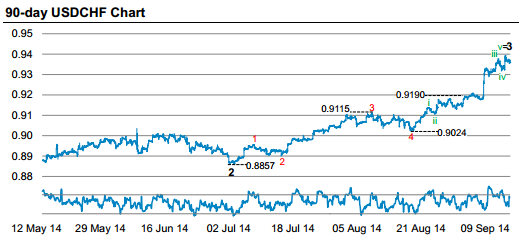
MS booked around 300-pip profit on its last USD/CHF long and now runs a limit order to re-buy at 0.9260.
Original post
Trading in financial instruments and/or cryptocurrencies involves high risks including the risk of losing some, or all, of your investment amount, and may not be suitable for all investors. Prices of cryptocurrencies are extremely volatile and may be affected by external factors such as financial, regulatory or political events. Trading on margin increases the financial risks.
Before deciding to trade in financial instrument or cryptocurrencies you should be fully informed of the risks and costs associated with trading the financial markets, carefully consider your investment objectives, level of experience, and risk appetite, and seek professional advice where needed.
Fusion Media would like to remind you that the data contained in this website is not necessarily real-time nor accurate. The data and prices on the website are not necessarily provided by any market or exchange, but may be provided by market makers, and so prices may not be accurate and may differ from the actual price at any given market, meaning prices are indicative and not appropriate for trading purposes. Fusion Media and any provider of the data contained in this website will not accept liability for any loss or damage as a result of your trading, or your reliance on the information contained within this website.
It is prohibited to use, store, reproduce, display, modify, transmit or distribute the data contained in this website without the explicit prior written permission of Fusion Media and/or the data provider. All intellectual property rights are reserved by the providers and/or the exchange providing the data contained in this website.
Fusion Media may be compensated by the advertisers that appear on the website, based on your interaction with the advertisements or advertisers.