U.S. Yields Clear Fields Of Gold
MarketPulse | Nov 14, 2016 05:07AM ET
The rise in U.S. yields continued in Asia Monday seeing the dollar juggernaut make further gains.
I must confess that the price action over the last few days since the unexpected Tr(i)ump(h) of Mr. Trump, has left me confused. As I write, I see zinc up 4.5% on the day. Chugging along nicely with the out in space rallies in copper, nickel, iron ore, coal, etc. Clearly, the street is pricing some serious reflationary pressures on commodities from the incoming President’s infrastructure rebuild in America. This simple kiwi notes a few things though
- Mr. Trump does not get the keys to the White House until January 20th. An age away in the financial markets at the moment.
- We do not know yet what the relationship will be with Congress even if both houses are Republican.
- We do not know yet what policies he will enact in the first 100 days and what effect they may have.
- We don’t even know yet who his actual “team” will be!
- Even in the most wildly ambitious deficit spending infrastructure building scenarios, the U.S.A will not become the importer of last resort of finished commodities at a level even remotely approaching China’s consumption of the last 20 years.
Having gotten that off my chest and putting the whole thing down to wildly optimistic, momentum based, herd following, fear of missing out traders, one thing I DO agree on is that we may have seen the bottom of US yields. That story is for another day, but rising US yields are certainly making their effect felt aka the emerging markets moves in Asia of the last few days. UST 10-Year yields have broken above 2.20% in Asia. Ignoring the Trump-tomistic driven rally in industrial base metals, some other setups in FX and most notably gold are going by the Trading 101 playbook.
Gold
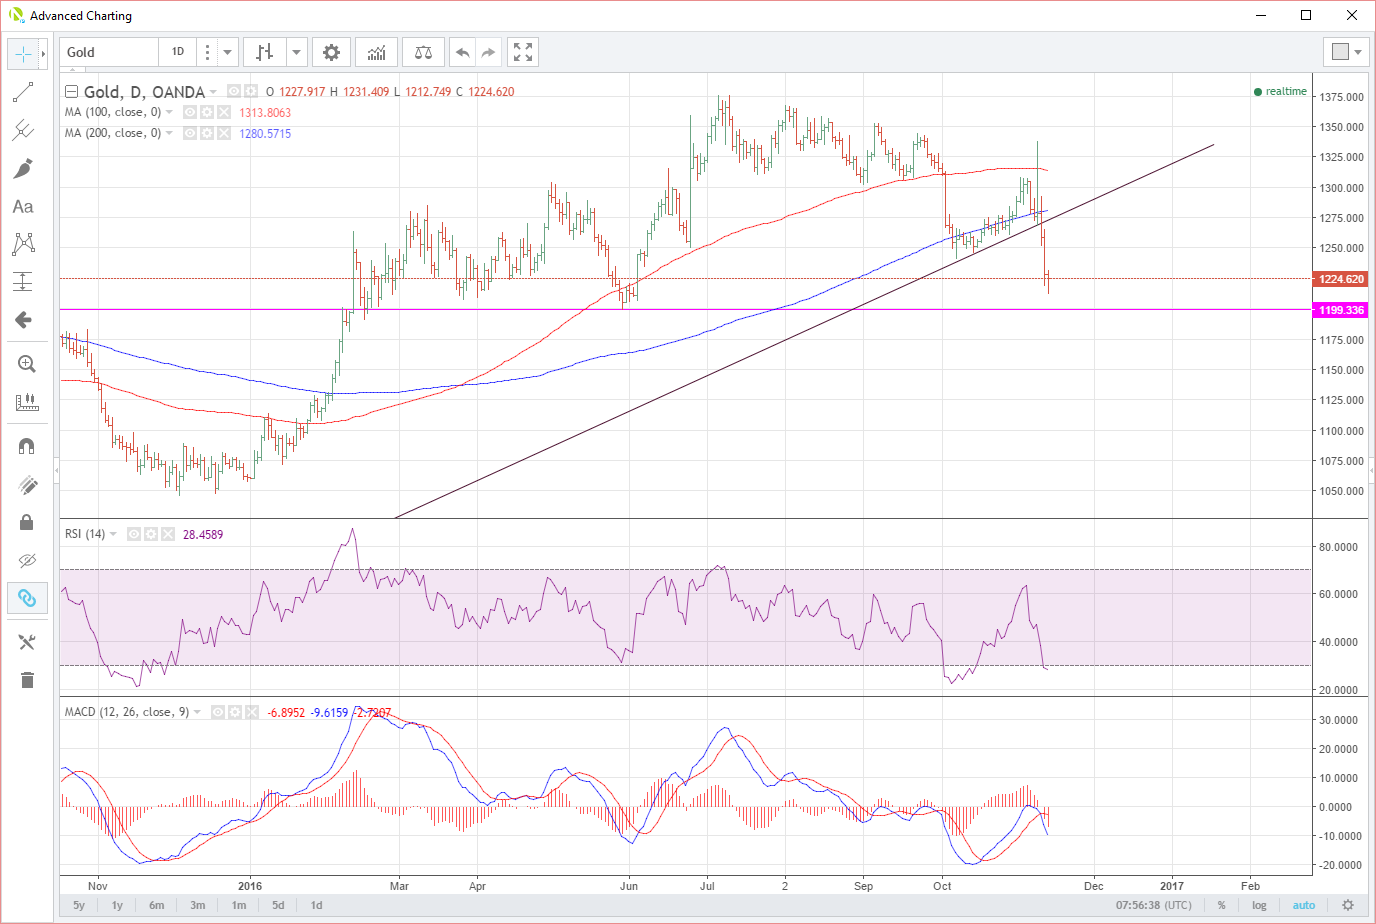
Gold blew through trendline support at the 1267/1270 area a few days ago and has not looked back. Higher yields and seemingly calm transition post-election have seen the safe haven play unwind big time. Friday’s price action smacked of mass stop-loss selling once the 1250 support level broke.
The chart itself shows support now at a triple bottom at 1199. 1200 will also be a psychological level with a daily close under this zone perhaps bringing more reassessment of long-term positions in the ETF market into play. Resistance sits at 1250 and then 1270 the previous trendline support.
There is a lot of clear air chart-wise under 1200 I must admit. I have also seen some analysts saying it is oversold here. However, the RSI, although nearing oversold territory is not supported by the MACD where the fast indicator, in blue, still points down. Gold bugs hoping for some relief may have to wait a bit longer.
Silver
No Silver Bullets here either with a very similar set-up to gold. Again, on Friday, once 18.4500 support trendline broke, things got messy as mass stop losses saw a collective running for a very small exit door. Silver also broke and closed below its 200-day moving average (DMA) at 17.1670 for the first time in 9 months.
Today silver is chewing away at important technical support at 17.0770, a multi-day low on the daily charts. The next technical support is a long way away at 15.8000. Resistance is at 17.1670 the 200DMA and the 18.4500 the aforementioned trendline.
Despite similar calls to gold, the RSI is not yet oversold and the MACD is showing no signs of turning. Traders should beware of catching a falling knife perhaps.
Platinum
The platinum chart hasn’t looked quite as ugly as its more famous brothers, perhaps because the recent rally looked like a dead cat bounce in a well-established downtrend, having already failed at the 200 DMA at 1017.00. This along with the 1000.00 are resistance today. Supports lies in a tentative zone between two lines at 925.45 and 911.075 as per the chart below.
Again the RSI is not oversold and the MACD is showing no signs of turning.
Palladium
Its industrial uses are clear to see. Rallying nicely today along with zinc, nickel, etc., shrugging off Fridays precious metals sell-off. Palladium perhaps highlights the divergence seen in precious/non-precious metals in this rising US interest rate environment. Sitting as it does, in a twilight zone across both.
Support is at 666.00, the number of the beast the 100 DMA, with resistance at 770.00.
And finally AUD/USD…The Asia Sell-off Surrogate
I have to slip the Aussie in here. As base metals have risen the AUD/USD has continued to fall. This is somewhat of a contrast as the Australia is one of the largest producers of the aforementioned base metals and even coking coal for steel production. It seems at odds that there is divergence here.
One of the main reasons I suspect is because Australia is also a high beta to regional emerging markets, and is used as an imperfect surrogate/correlation trade to regional Asia. The main reason being that most of regional Asia have restricted capital markets and USD pegs. The Australian market is neither and is large enough to provide sensible liquidity as well. Thus with higher USD yields blowing chills winds through
Thus with higher USD yields blowing chills winds through the emerging markets of Asia over the last few days, an easier play for desperate investors, as liquidity dried up in on-shore and offshore Asian FX trading, was to sell the AUD. Remember, “an emerging market is a market you can’t emerge from in an emergency.”
Looking at the AUD/USD chart, we have broken the trendline that has held AUD for all of 2016 at the 7590 level. This is also the 100 DMA so it was an important level. This becomes resistance with support at 7508 the 200 DMA and then the 7420 region.
Original post
Trading in financial instruments and/or cryptocurrencies involves high risks including the risk of losing some, or all, of your investment amount, and may not be suitable for all investors. Prices of cryptocurrencies are extremely volatile and may be affected by external factors such as financial, regulatory or political events. Trading on margin increases the financial risks.
Before deciding to trade in financial instrument or cryptocurrencies you should be fully informed of the risks and costs associated with trading the financial markets, carefully consider your investment objectives, level of experience, and risk appetite, and seek professional advice where needed.
Fusion Media would like to remind you that the data contained in this website is not necessarily real-time nor accurate. The data and prices on the website are not necessarily provided by any market or exchange, but may be provided by market makers, and so prices may not be accurate and may differ from the actual price at any given market, meaning prices are indicative and not appropriate for trading purposes. Fusion Media and any provider of the data contained in this website will not accept liability for any loss or damage as a result of your trading, or your reliance on the information contained within this website.
It is prohibited to use, store, reproduce, display, modify, transmit or distribute the data contained in this website without the explicit prior written permission of Fusion Media and/or the data provider. All intellectual property rights are reserved by the providers and/or the exchange providing the data contained in this website.
Fusion Media may be compensated by the advertisers that appear on the website, based on your interaction with the advertisements or advertisers.