U.S. Tech Sector Setting Up For A Momentum Breakout Move
Chris Vermeulen | Feb 12, 2019 04:45PM ET
Our research team has warned that the precious metals market would enter a 30-45 day rotational price trend back on January 28, 2019. On January 16, 2019, we suggested that the upside price move in the U.S. stock market had reached initial upside target zones and suggested that price pullback would be healthy near these levels. Today, we are warning that the markets are poised for a momentum breakout move that is setting up after the minor pullback in most U.S. stock sectors last week.
There are a number of news factors that support both our analysis of the precious metals market and the failure of stock analysis. First, we have the opportunity for the U.S. government to agree to and pass a funding bill that removes uncertainty for many months. If the government is able to pass a longer-term funding bill that eliminates pricing pressures and fears in the markets, the U.S. stock market could breakout to the upside on a new momentum move very quickly. Second, if the U.S.-China trade issues are resolved, in any substantial form, and trade begins to normalize over the next 6+ months, this could add even more fuel to the upside of the market and create a boost of momentum for almost all sectors.
The big question remains, which side of the fence will this news fall to and what will the likely outcome be in the U.S. stock market?
We continue to believe a massive capital shift is taking place throughout the globe. Investors and traders are continually seeking safety and returns for their capital. Even the emerging markets present a unique opportunity right now, although they also present a high degree of risk. We believe any news related to the U.S. government funding and/or the U.S.-China trade issues will result in a new momentum rally in U.S. stocks, potentially resulting in a 4-8% upside rally.
Downside Risk
Right now, unless some news solidifies regarding either of the two news events, we believe a downside price rotation is still in the cards starting next week and could last 15-25 days. Should some news hit the wires that alleviates the uncertainty and concerns, then the downside expectations we have may be muted or failed expectations.
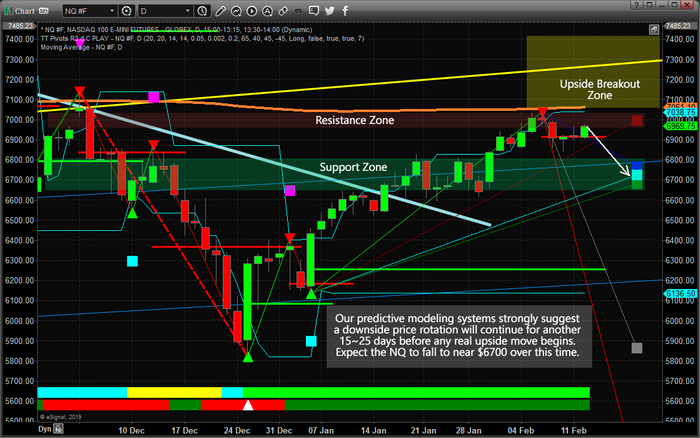
Take a look at this daily NASDAQ chart with our Adaptive Fibonacci price modeling system. It is easy to see the Fibonacci projected target levels clustering near the $6,700 level. It is also easy to see the upside (RED) projected level near $7,000. Fibonacci theory teaches us that price is constantly seeking out new highs or new lows. Over the past few days, the price has settled into a range between $6,840 and $7,038. Given Fibonacci price theory rules, price MUST attempt either a new high or a new low outside this range.
Our research suggests that a new price low is the highest probability outcome at this time (unless news hits to change the environment within the markets). Therefore, we still believe the downside price levels near $6,700 are the immediate target levels for the NQ with an “exception” being the “Upside Breakout Zone”. This upside breakout/rally zone qualifies as the opposite condition to our expectations. If news breaks and the market does begin a momentum rally based on the news, then this upside zone will qualify for a Long Entry Zone with a potential for a very quick 2-5% upside potential.
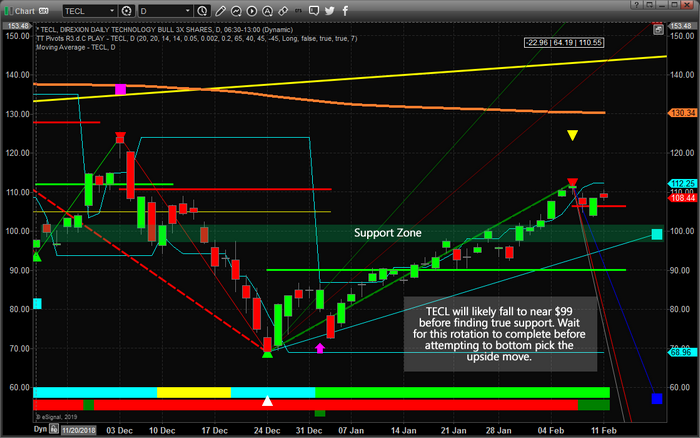
This daily TECL chart with our Fibonacci price modeling system suggests the same type of outcome. Barring any news events that change the investing environment, there is a strong potential for price to rotate lower toward the $99 level. Remember, price rotation is very healthy and essential. If we think about the primary rule of Fibonacci price theory, the price must always seek out new price highs or new price lows, it makes sense that price will trend while creating rotational zones. Thus, a move to $99 would qualify as a new price low (breaking more recent low-price levels) and rotation back to the upside would qualify as a price direction change where new price highs will be attempted.
The one thing we have to remember as we navigate this 15-25 expected rotational price range is that external news events can have dramatic results in the markets. Our research team continues to scan news sources for sentiment and other market conditions. Gold fans are expecting prices to rally above $1,320 very quickly. Most equity traders are concerned about the current price rotation in the U.S. stock market and the massive range that has setup. Very few people have any real understanding of the future direction of these markets – everyone seems to be waiting for the next move.
We believe 2019 and 2020 will be incredible years for skilled traders and we are executing at the highest level we can to assist our member's profit from our trades. In fact, we are about to launch our newest technology solution for our members that is unparalleled anywhere else.
We've recently shown you what our predictive modeling systems believe is the likely outcome for the S&P 500 and NASAQ over the next few months and we are waiting for the proper “setup” to reposition our members for the next move.
Trading in financial instruments and/or cryptocurrencies involves high risks including the risk of losing some, or all, of your investment amount, and may not be suitable for all investors. Prices of cryptocurrencies are extremely volatile and may be affected by external factors such as financial, regulatory or political events. Trading on margin increases the financial risks.
Before deciding to trade in financial instrument or cryptocurrencies you should be fully informed of the risks and costs associated with trading the financial markets, carefully consider your investment objectives, level of experience, and risk appetite, and seek professional advice where needed.
Fusion Media would like to remind you that the data contained in this website is not necessarily real-time nor accurate. The data and prices on the website are not necessarily provided by any market or exchange, but may be provided by market makers, and so prices may not be accurate and may differ from the actual price at any given market, meaning prices are indicative and not appropriate for trading purposes. Fusion Media and any provider of the data contained in this website will not accept liability for any loss or damage as a result of your trading, or your reliance on the information contained within this website.
It is prohibited to use, store, reproduce, display, modify, transmit or distribute the data contained in this website without the explicit prior written permission of Fusion Media and/or the data provider. All intellectual property rights are reserved by the providers and/or the exchange providing the data contained in this website.
Fusion Media may be compensated by the advertisers that appear on the website, based on your interaction with the advertisements or advertisers.