U.S. Major Indexes Consolidate Into Sideways Pattern
Chris Vermeulen | May 31, 2021 12:47AM ET
Over the past few weeks, the U.S. major indexes have consolidated into a sideways price channel. This is most obvious on the NASDAQ and SPY charts as we’ve seen moderately deep pullbacks through the months of April/May 2021. My research suggests this sideways price flagging might be concerning for active traders/investors.
When the market flags into a sideways price pattern and near an Apex level, price tends to act in a very aggressive manner while attempting to establish a new trend. The longer price continues to trade within that sideways/flagging price range, the more aggressive and violent the new trend may be when it finally breaks free of the sideways price channel.
After Many Weeks Of Sideways Price Trending – What’s Next?
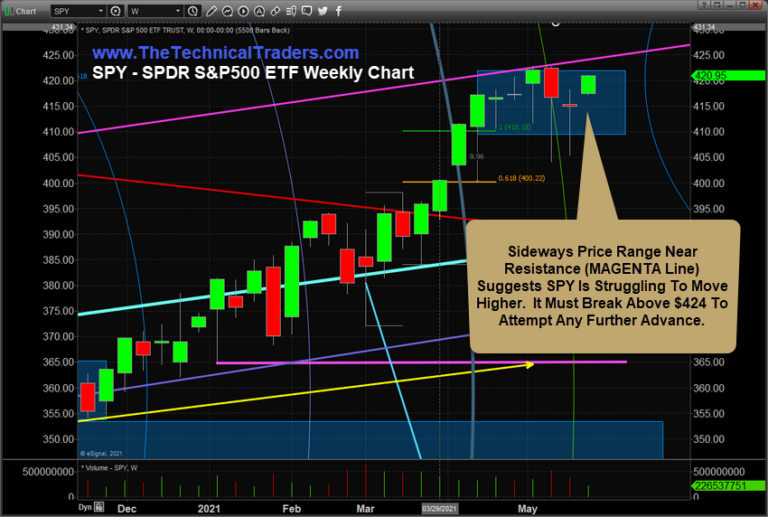
The Weekly SPY chart, below, highlights the seven weeks of moderate sideways price activity and shows the extended resistance level (MAGENTA Line) which represents an almost extreme rally trend originating from the 2009~2011 initial price bottom/rally after the housing/credit crisis. My research team and I are cautious of how the SPY has rallied recently, targeting the prior MAGENTA Line trend level and then dramatically stalled after briefly touching this level.
Long Term SPY Chart Highlights Incredible Price – 'Fuzzy Double Top' From 2009 Bottom Levels
The following Monthly SPY chart shows you the bigger picture. As the bottom setup in 2009-2010, price rallied sharply and set up an upward sloping price channel off these highs. Usually, as prices move away from the bottom, a sharp recovery may take place initially after the bottom completes. This initial upward price trend often represents some of the strongest upward price momentum one will see as the bullish trend continues to unfold. It is very unusual for price to rally very strongly after a deep price bottom, then move into weaker bullish trending, then begin to accelerate into a very aggressive upward price trend targeting or reaching the initial bullish momentum after the initial deep bottom level.
This is exactly what happened in this case with the SPY. Price rallied off the bottom, began to stall in a bullish trend while still moving higher, then after COVID-19 began to rally excessively back to the original MAGENTA upward sloping price channel. This type of price activity is very unusual and typically relates to a hyper-parabolic price trend.

Transportation Index Forming Tight Price Flag – Which Way Will It Break?
This Weekly Transportation Index highlights the Flagging price formation that has recently set up. Although one could argue the current trend is still very bullish overall, the recent sideways price formation suggests the momentum behind the recent bullish price trend has weakened. We have drawn both bullish and bearish arrows on this chart to illustrate that the Apex of the Flag formation may prompt some type of wild, volatile price activity. This Apex has nearly completed as of last week. It is very likely that a more volatile price trend will begin over the next few weeks and we believe this could be the beginning of a bigger price trend lasting through August or September 2021.
If the trend resumes as a bullish price trend, then we may continue to see a melt-up in price targeting the $16,500 level (or higher). If the trend breaks lower, then we believe the Transportation Index may attempt to move below the $14,000 level and possibly attempt to retest the early 2021 lows near $12,000.
Custom Volatility Index Confirms Bigger, Aggressive Price Trends/Breakouts Are Pending
Lastly, we want to highlight our Custom Volatility Index Weekly chart – which we use to measure and gauge market peaking and bottoming setups as well as overall trend direction and momentum. When the Custom Volatility Index moves above 12~13, it is nearing an extreme bullish trend phase (or potentially nearing a peak price level where bullish momentum may stall). When the Custom Volatility Index moves below the 9~10 level after reaching the 12~13+ level, we are experiencing a moderate price pullback (usually). When the Custom Volatility Index falls below the 9~10 level, this suggests the markets are breaking major support channels and falling into a new type of Bearish trending (possibly attempting to target the 3~5 level – or lower).
Currently, the Custom Volatility Index has reached levels above 14 on Apr. 12, 2021. That is the origination of this recent stalling in the Weekly SPY chart (near the top of this article). The current sideways price action in the SPY after April 12 was illustrated in the Custom Volatility Index as the large candlestick bars rotating near the 10~11 level. This period represents a fairly large range price volatility period where prices have stalled.
Now, the Custom Volatility Index is back above 13.50 and reached a high of 14.33. This move higher suggests the markets are back into bullish exhaustion/peaking range while the SPY and Transportation Index are still suggesting a sideways price Flag formation is Apexing. We expect some very volatile price action to pick up throughout most of June 2021 which may prompt a new major price trend in the US Major Indexes because of this setup.
As various assets seek out critical support and resistance levels in early June 2021, pay attention to how markets react near past critical stand-out lows and highs. For example, The Transportation Index chart, above, highlights a “stand-out” low near $12,000 that is a likely downside price target if we see a breakdown trend in early June. These past stand-out price levels often represent very important support and resistance levels for technical traders.
Again, we are not making a prediction that a breakdown event is going to crash the markets right now. We are suggesting that a price volatility event is about to happen in early June based on our research. This volatility event may prompt a new major price trend if the event is big enough to break through historic support/resistance levels. If not, then we may see a moderate 8 to 11% price rotation take place before the markets resume the bullish trending phase again.
We are suggesting that traders prepare for this volatility event which appears to likely happen in early June 2021 and may last many weeks (through August or September 2021). Only time will tell how this plays out, but we are fairly certain a spike in the VIX is near and that we may see a moderate downside move in the SPY – possibly below $400. Many various sectors will likely rotate as well and set up excellent opportunities for active traders throughout this volatility event.
Enjoy the rest of your Memorial Day Weekend!
Trading in financial instruments and/or cryptocurrencies involves high risks including the risk of losing some, or all, of your investment amount, and may not be suitable for all investors. Prices of cryptocurrencies are extremely volatile and may be affected by external factors such as financial, regulatory or political events. Trading on margin increases the financial risks.
Before deciding to trade in financial instrument or cryptocurrencies you should be fully informed of the risks and costs associated with trading the financial markets, carefully consider your investment objectives, level of experience, and risk appetite, and seek professional advice where needed.
Fusion Media would like to remind you that the data contained in this website is not necessarily real-time nor accurate. The data and prices on the website are not necessarily provided by any market or exchange, but may be provided by market makers, and so prices may not be accurate and may differ from the actual price at any given market, meaning prices are indicative and not appropriate for trading purposes. Fusion Media and any provider of the data contained in this website will not accept liability for any loss or damage as a result of your trading, or your reliance on the information contained within this website.
It is prohibited to use, store, reproduce, display, modify, transmit or distribute the data contained in this website without the explicit prior written permission of Fusion Media and/or the data provider. All intellectual property rights are reserved by the providers and/or the exchange providing the data contained in this website.
Fusion Media may be compensated by the advertisers that appear on the website, based on your interaction with the advertisements or advertisers.