US Index Futures Turn Red After 9 Days of Consecutive Gains
MarketPulse | May 05, 2025 04:35AM ET
Despite market closures in Hong Kong, Japan, and China for public holidays today (5 May), global markets saw notable moves during the Asian session.
Following the S&P 500’s nine-day winning streak—its longest since 2004—US stock index futures opened weaker. As of this writing, the S&P 500 and Nasdaq 100 E-mini futures are down 0.7% intraday.
The current weakness seen in the US stock index futures has been accompanied by a revival of US dollar weakness after the US Dollar Index failed to break above its 20-day moving average, which is acting as a key intermediate resistance at around 100.15 in the past three sessions.
The FX market is being spooked with the possibility that Japan may start to dump a portion of its massive US Treasury bonds holdings after Japan Finance Minister Kato mentioned in a media interview last Friday, 2 May, that Japan’s US Treasuries holdings could be used as a negotiation card in US-Japan trade negotiation talks which is being seen as a negative narrative on the US dollar.
Even though Japan Finance Minister Kato retraced his earlier comments about using US Treasuries as a negotiation tool on Sunday, the US dollar has continued to display weakness in today’s Asian session as it declined against the NZD (-0.8%), JPY (-0.7%), and AUD (-0.5%) at this time of writing.
Oil gapped down in today’s Asian opening session by 5%, where the West Texas crude oil traded to a current intraday low of US$55.81/barrel, just a whisker away from its key 9 April low of 55.23/barrel in light of more supplies from the Middle East coupled with the prospect of weakening oil demand due to US trade tariffs uncertainty.
OPEC+ has decided at a meeting last Saturday, 3 May, to increase the cartel production hike of more than 400,000 barrels a day from June, which matched a similar increase last month.
Economic Data Releases
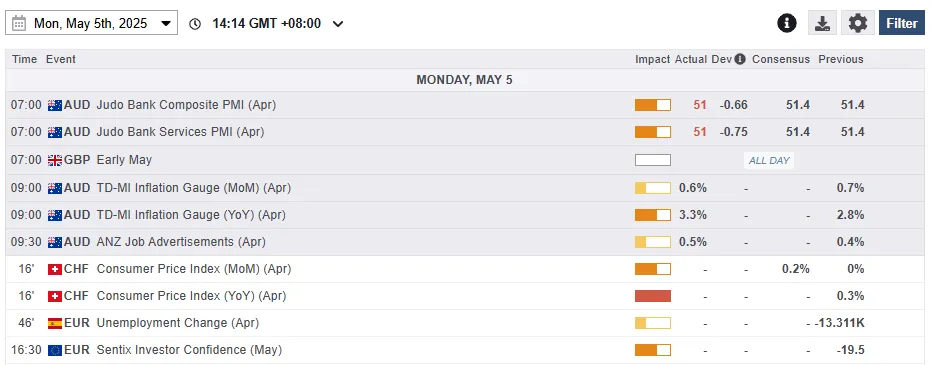
Source: MarketPulse
Fig 1: Key data for today’s Asian mid-session
Chart of the Day – Potential Bearish Reversal for Nasdaq 100 at 200-day MA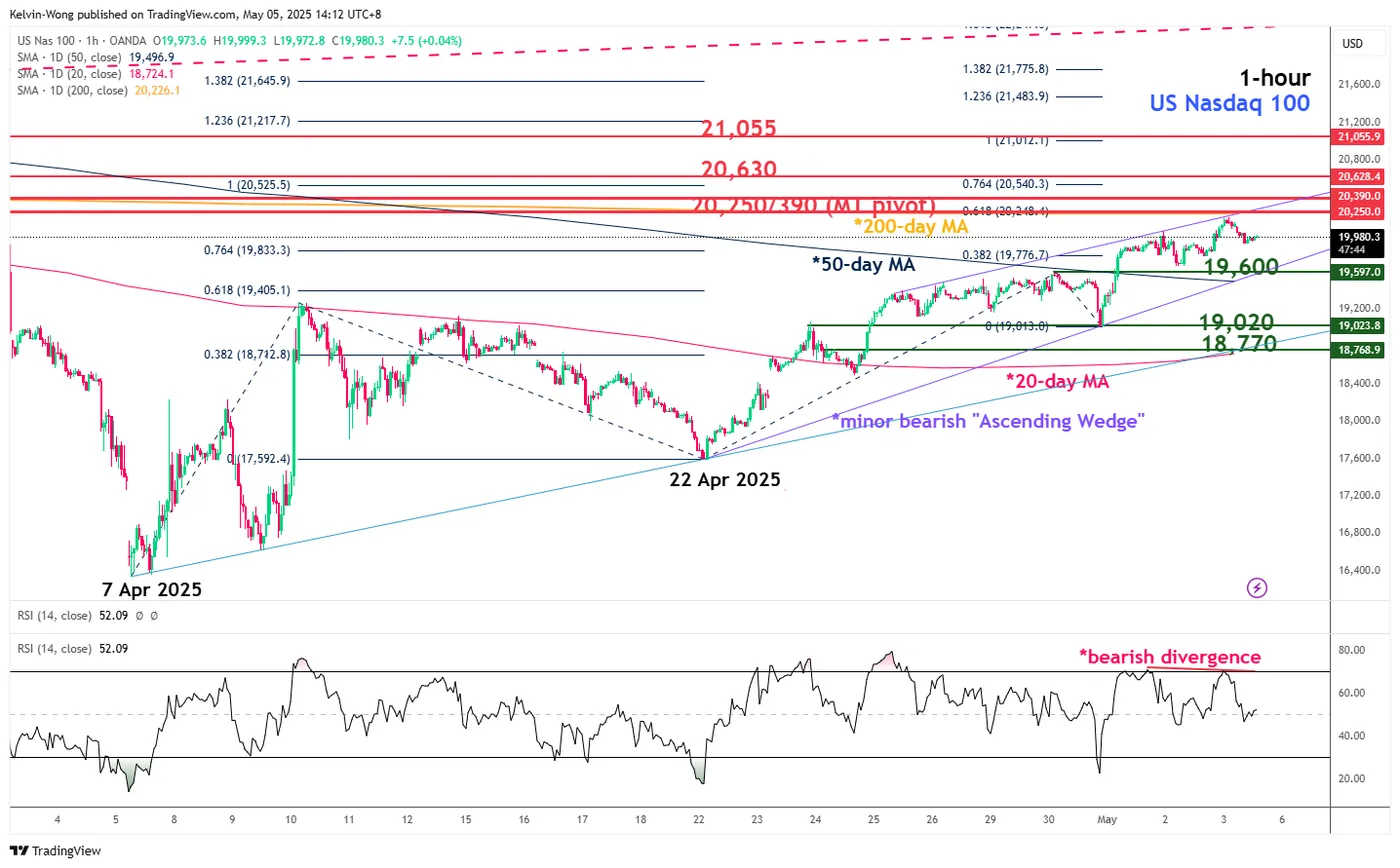
Source: TradingView
Fig 2: US Nasdaq 100 CFD Index minor trend as of 5 May 2025
Since 22 April 2025, the price actions of the US Nasdaq 100 CFD Index (a proxy of the Nasdaq 100 futures) have evolved into a potential “Ascending Wedge” bearish reversal configuration
Last Friday’s price movement has hit the upper limit of the “Ascending Wedge,” and to key 200-day moving average coupled with a bearish divergence condition being flashed out on its hourly RSI momentum indicator at its overbought region.
Hence, these observations suggest that the 4-week up move of the US Nasdaq 100 CFD Index from its 7 April low may have reached an exhaustion point where the ongoing rally may roll over into a potential bearish reversal sequence.
Watch the 20,250/20,390 key medium-term pivotal resistance zone, and a break below 19,600 near-term support (also the lower limit of the “Ascending Wedge” may see further potential weakness towards the next intermediate support zone of 19,020/18,770 (also the 20-day moving average) (see Fig 2).
On the flip side, a clearance above 20,390 invalidates the bearish scenario for a continuation of the recovery for the next intermediate resistances to come in at 20,630 and 21,055.
Original Post
Trading in financial instruments and/or cryptocurrencies involves high risks including the risk of losing some, or all, of your investment amount, and may not be suitable for all investors. Prices of cryptocurrencies are extremely volatile and may be affected by external factors such as financial, regulatory or political events. Trading on margin increases the financial risks.
Before deciding to trade in financial instrument or cryptocurrencies you should be fully informed of the risks and costs associated with trading the financial markets, carefully consider your investment objectives, level of experience, and risk appetite, and seek professional advice where needed.
Fusion Media would like to remind you that the data contained in this website is not necessarily real-time nor accurate. The data and prices on the website are not necessarily provided by any market or exchange, but may be provided by market makers, and so prices may not be accurate and may differ from the actual price at any given market, meaning prices are indicative and not appropriate for trading purposes. Fusion Media and any provider of the data contained in this website will not accept liability for any loss or damage as a result of your trading, or your reliance on the information contained within this website.
It is prohibited to use, store, reproduce, display, modify, transmit or distribute the data contained in this website without the explicit prior written permission of Fusion Media and/or the data provider. All intellectual property rights are reserved by the providers and/or the exchange providing the data contained in this website.
Fusion Media may be compensated by the advertisers that appear on the website, based on your interaction with the advertisements or advertisers.