US Equities Hold Strong Despite Bullish Threats
Tech Talk | Sep 22, 2014 05:52AM ET
Upcoming US Events for Today:
- Chicago Fed National Activity Index for August will be released at 8:30am. The market expects 0.35 versus 0.39 previous.
- Existing Home Sales for August will be released at 10:00am. The market expects 5.18M versus 5.15M previous.
Upcoming International Events for Today:
- Euro-Zone Consumer Confidence for September will be released at 10:00am EST. The market expects –10.5 versus –10.0 previous.
- China HSBC Manufacturing PMI for September will be released at 9:45pm EST. The market expects 50.0 versus 50.2 previous.
The Markets
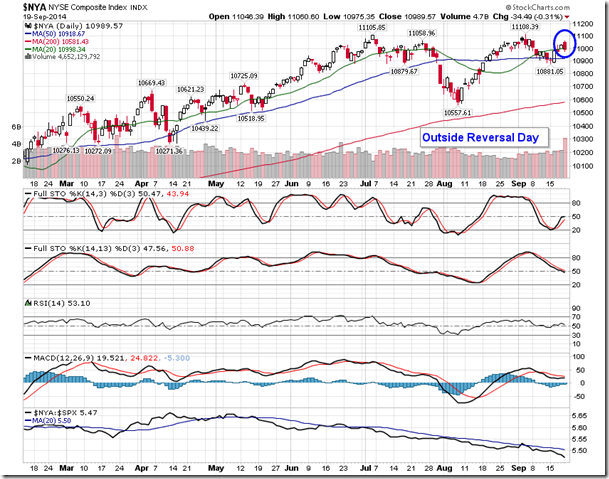
Stocks ended lower on Friday, reversing the gains charted during the early morning hours as investors anticipated the first trades from the Alibaba IPO. The NYSE Composite ended down by 0.31%, charting an outside reversal session around the all-time highs for the equity benchmark. The reversal from the highs of the session suggests upside exhaustion as investors take advantage of the euphoria surrounding the IPO event to “sell on news,” booking profits following the recent rally. As noted in Friday’s report, the equity market, as gauged by the S&P 500, has traded lower by an average of 0.52% in the session following the largest 24 IPOs in US history,suggesting further profit taking is likely into Monday’s session. Equity markets remain in a seasonally weak period that stretches through to the start of October.
Despite the period of seasonal weakness for stocks in front of us, US equities have held up rather well given the ongoing threats to the bullish case for stocks. The S&P 500 Index ended higher last week by 1.25%, once again charting new all-time highs. However, Canadian stocks were not so fortunate. The TSX Composite ended lower on the week by 1.71%, influenced by a broad selloff in Materials, Energy, and Financials, Canada’s three dominant equity sectors. The Canadian benchmark ended firmly below its rising 50-day moving average, a key level of support that has influenced the equity benchmark higher for well over a year. The underperformance in the TSX Composite is typical for this time of year. On average, the Canadian benchmark underperforms the S&P 500 from the start of September through to the beginning of December, dragged lower by, among other things, energy stocks, which typically decline through the fourth quarter as a result of weaker oil prices. Average underperformance of the TSX Composite versus the S&P 500 surpasses 4% by the first week in December.
As mentioned, the energy sector has been a factor in the historical weakness of the Canadian market during the majority of the fourth quarter. A bearish pattern on the chart of the Canadian energy sector benchmark suggests that it could continue to act as a strain on the broad Canadian market. On Friday, the S&P/TSX Capped Energy Index broke through the neckline of a head-and-shoulders topping pattern, a bearish setup that targets over 8% below present levels. The energy sector benchmark has been underperforming the market since mid-June, trading lower as oil prices plunge. The Canadian Materials sector is suggesting a similarly bearish setup. Double top resistance on the chart of the S&P/TSX Capped Capped Materials Index could result in downside potential of around 16%, should support be broken at the June lows. The materials sector has shown significant underperformance versus the market since mid-August, following a seasonal trend that is typical at this time of year for stocks in this space. The weakness in these two critical sectors for the TSX Composite suggest reason to avoid the Canadian market through the next couple of months; benchmarks with heavier weightings in consumer stocks, given the upcoming holiday season, are generally preferred through to the start of December.
Seasonal charts of companies reporting earnings today:
Sentiment on Friday, as gauged by the put-call ratio, ended bullish at 0.83.
S&P 500 Index
TSE Composite
Horizons Seasonal Rotation ETF (TSX:HAC)
- Closing Market Value: $14.34 (unchanged)
- Closing NAV/Unit: $14.35 (up 0.01%)
Performance*
| 2014 Year-to-Date | Since Inception (Nov 19, 2009) | |
| HAC.TO | 0.35% | 35.4% |
* performance calculated on Closing NAV/Unit as provided by custodian
Trading in financial instruments and/or cryptocurrencies involves high risks including the risk of losing some, or all, of your investment amount, and may not be suitable for all investors. Prices of cryptocurrencies are extremely volatile and may be affected by external factors such as financial, regulatory or political events. Trading on margin increases the financial risks.
Before deciding to trade in financial instrument or cryptocurrencies you should be fully informed of the risks and costs associated with trading the financial markets, carefully consider your investment objectives, level of experience, and risk appetite, and seek professional advice where needed.
Fusion Media would like to remind you that the data contained in this website is not necessarily real-time nor accurate. The data and prices on the website are not necessarily provided by any market or exchange, but may be provided by market makers, and so prices may not be accurate and may differ from the actual price at any given market, meaning prices are indicative and not appropriate for trading purposes. Fusion Media and any provider of the data contained in this website will not accept liability for any loss or damage as a result of your trading, or your reliance on the information contained within this website.
It is prohibited to use, store, reproduce, display, modify, transmit or distribute the data contained in this website without the explicit prior written permission of Fusion Media and/or the data provider. All intellectual property rights are reserved by the providers and/or the exchange providing the data contained in this website.
Fusion Media may be compensated by the advertisers that appear on the website, based on your interaction with the advertisements or advertisers.