U.S. Dollar's Resistance Could Align With Long Bonds' Reversal Higher
Michele Schneider | Aug 23, 2023 03:14AM ET
With BRICS happening ahead of Jackson Hole, we thought it would be good to look at the technical charts on both the US dollar and the long bonds (NASDAQ:TLT).
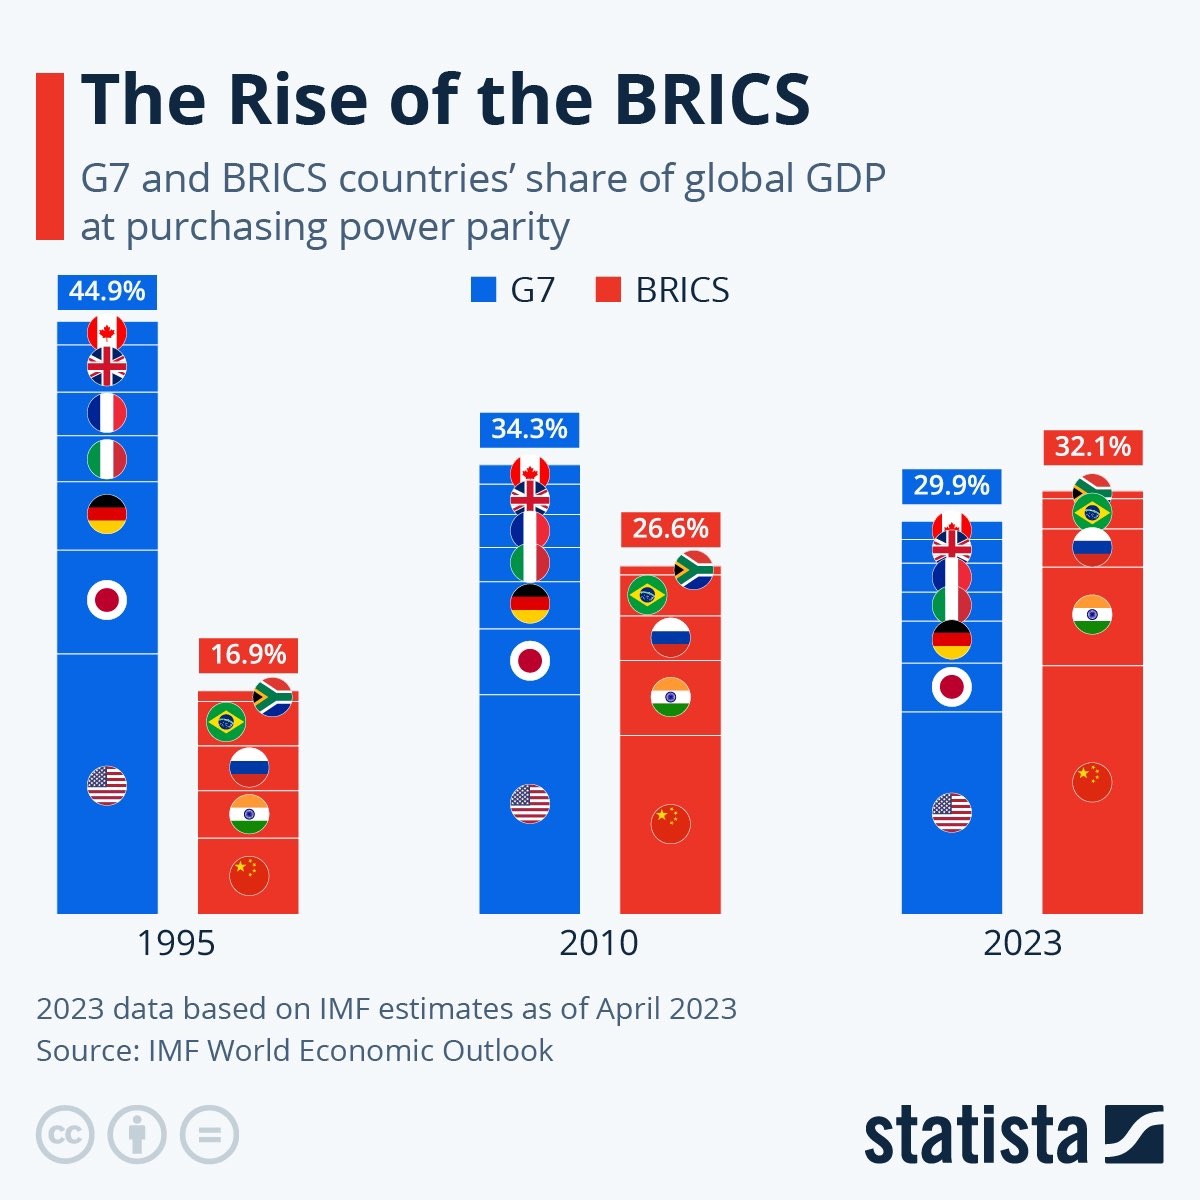
The chart below shows that BRICS versus G7 as a share of purchasing power has increased since 1995.
With the number of countries looking to price goods in some other currency besides the US dollar, the dollar is holding up rather well.
And, with “higher for longer” most likely the narrative out of Jackson Hole, the long bonds caught a bid.
The lesson this entire year has been to follow prices and the technical guidance the charts provide.
With that in mind, we look at 3 indicators on both charts.
- Price patterns
- Momentum patterns
- July 6-month calendar range patterns.
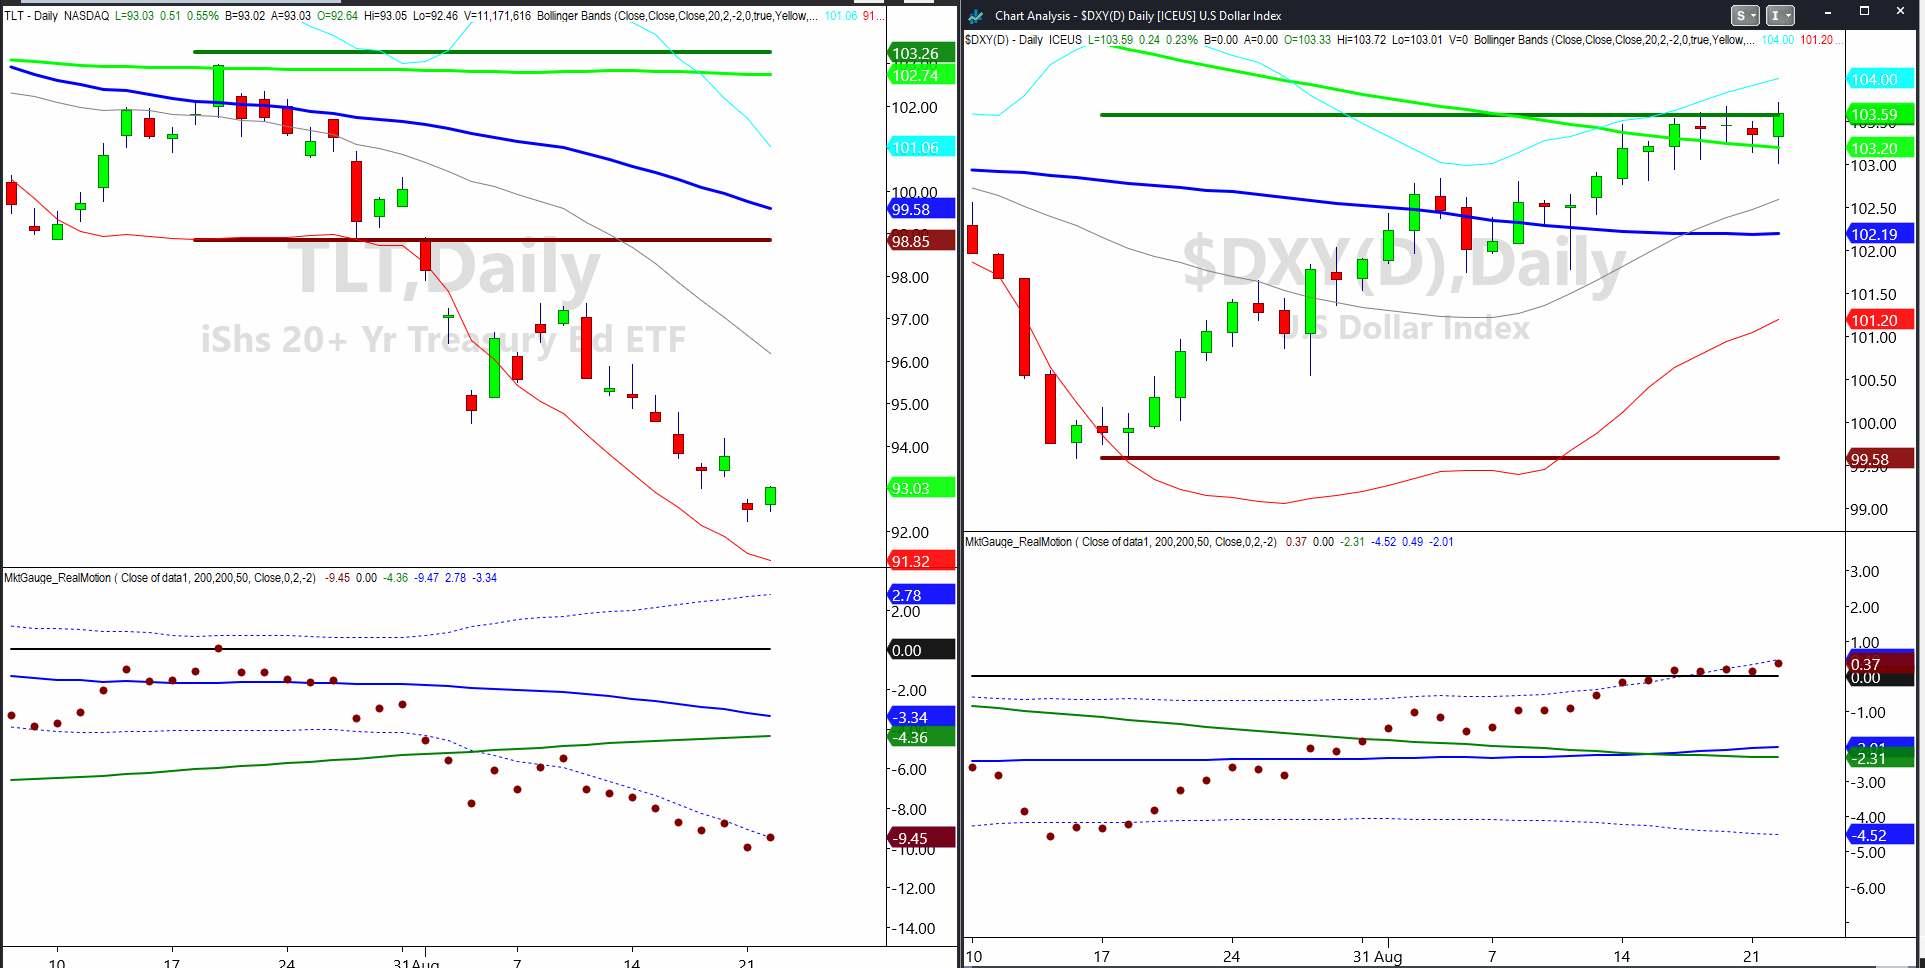
The long bonds TLT could have made a genuine reversal off the lows as our Real Motion indicator had a bona fide mean reversion signal.
The price also indicates a glass bottom pattern with a reversal off a new low, followed by a strong up day on below-average volume.
TLT is so well below the July 6-month calendar range low that one has to wonder not only can it get back to 98.85, but what are the implications if it does so?
The dollar, as far as price, has a lot of resistance between 103.50 and 103.70. In fact, that resistance lines up perfectly with the July 6-month calendar range high.
Above that level, one would have to believe that the dollar will get even stronger.
Nonetheless, as we have seen with the calendar ranges in the indices, since none cleared the July 6-month calendar range high, the sell-off was palpable.
Momentum shows resistance at the Bollinger Band that is also working off of a mean reversion sell signal from a few days ago.
However, the price is flat.
If you put both charts together, we see the potential for the dollar to drop from here while yields could soften and TLTs could rise.
If this occurs, it is not good for equities or risk.
But, perhaps, quite good for gold and silver.
ETF Summary
- S&P 500 (SPY) 437 is the July 6-month calendar range low-will look for a return above or a trip to 420
- Russell 2000 (IWM) 181.94 the low of last week is key-180.72 the 6-momth calendar range low
- Dow (DIA) 337 key support
- Nasdaq (QQQ) 363 the July 6 month CRL-BUT held a key weekly MA at 357 with NVDA earnings on tap
- Regional banks (KRE) Failed 44.00 on bank downgrades-no bueno
- Semiconductors (SMH) 145 a weekly MA support level with 150 pivotal
- Transportation (IYT) Getting heavy with next big support at 239 if this is to hold.
- Biotechnology (IBB) Compression between 124-130
- Retail (XRT) 62.80 the July 6-mo. calendar range low failed today-consumer is key and this is also no bueno
Trading in financial instruments and/or cryptocurrencies involves high risks including the risk of losing some, or all, of your investment amount, and may not be suitable for all investors. Prices of cryptocurrencies are extremely volatile and may be affected by external factors such as financial, regulatory or political events. Trading on margin increases the financial risks.
Before deciding to trade in financial instrument or cryptocurrencies you should be fully informed of the risks and costs associated with trading the financial markets, carefully consider your investment objectives, level of experience, and risk appetite, and seek professional advice where needed.
Fusion Media would like to remind you that the data contained in this website is not necessarily real-time nor accurate. The data and prices on the website are not necessarily provided by any market or exchange, but may be provided by market makers, and so prices may not be accurate and may differ from the actual price at any given market, meaning prices are indicative and not appropriate for trading purposes. Fusion Media and any provider of the data contained in this website will not accept liability for any loss or damage as a result of your trading, or your reliance on the information contained within this website.
It is prohibited to use, store, reproduce, display, modify, transmit or distribute the data contained in this website without the explicit prior written permission of Fusion Media and/or the data provider. All intellectual property rights are reserved by the providers and/or the exchange providing the data contained in this website.
Fusion Media may be compensated by the advertisers that appear on the website, based on your interaction with the advertisements or advertisers.