SPX: Upward Reversal Or Just Quick Rebound Before Another Leg Down?
Sunshine Profits | Mar 23, 2017 08:08AM ET
Briefly: In our opinion, speculative short positions are favored (with stop-loss at 2,410, and profit target at 2,200, S&P 500 index).
Our intraday outlook is bearish, and our short-term outlook is bearish. Our medium-term outlook remains neutral, following S&P 500 index breakout above last year's all-time high:
Intraday outlook (next 24 hours): bearish
Short-term outlook (next 1-2 weeks): bearish
Medium-term outlook (next 1-3 months): neutral
Long-term outlook (next year): neutral
The U.S. stock market indexes were mixed between 0.0% and +0.7% on Wednesday, as investors hesitated following Tuesday's relatively big move down. Traders took profits off the table after last week's interest rates increase, among others. The S&P 500 index remained more than 2% below its March 1 all-time high of 2,400.98.
The Dow Jones Industrial Average continued to trade below 20,700 mark, and the technology NASDAQ Composite index bounced by 0.5%, as it broke above the level of 5,800 again. Overall, stocks continued to trade below their almost month-long consolidation along new record highs. Is this just correction or a new downtrend?
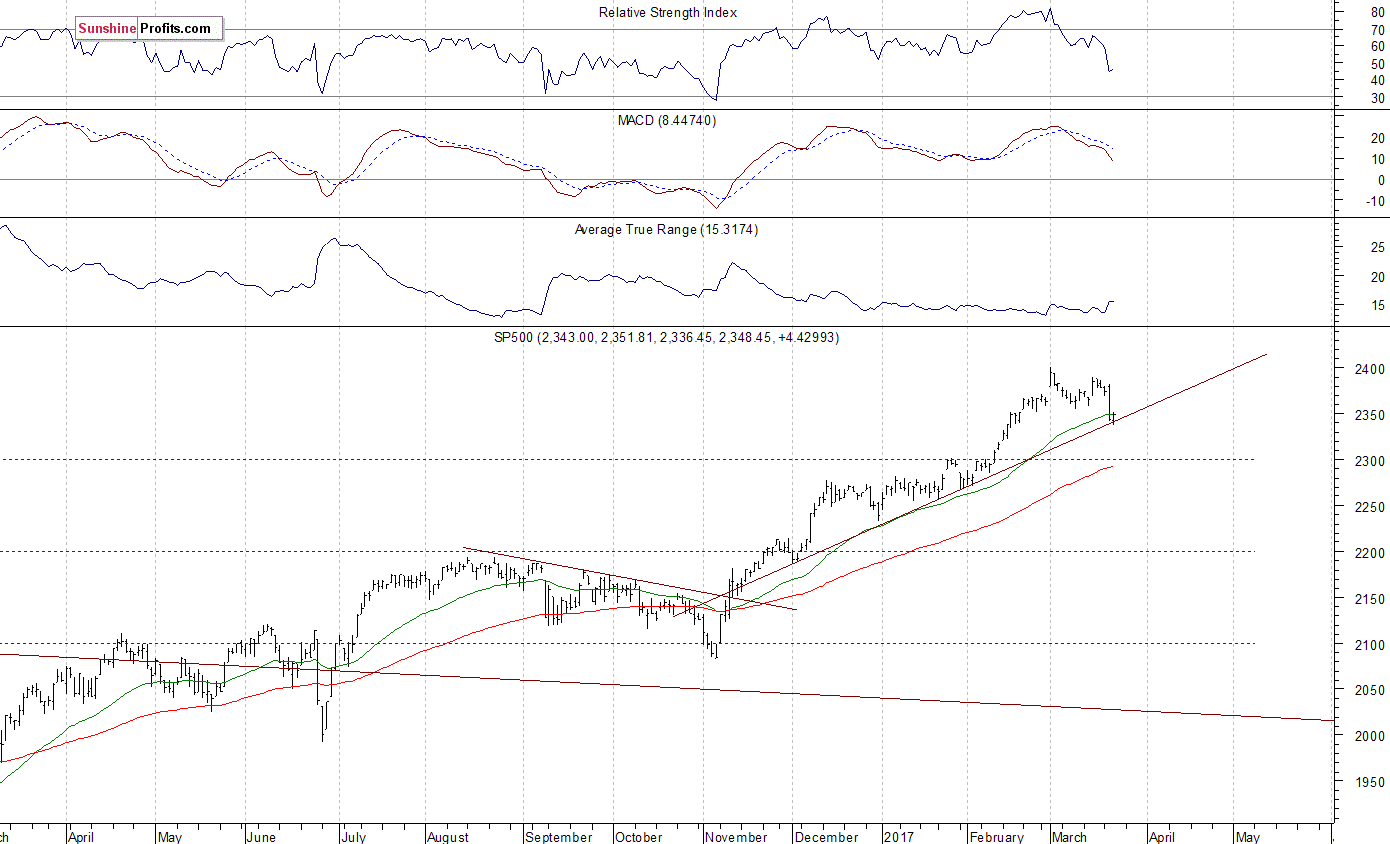
For now, it looks like a downward correction within medium-term uptrend. The nearest important level of support of the S&P 500 index is at around 2,335-2,340, marked by some previous local lows. The next support level remains at 2,320, marked by February 13 daily gap up of 2,319.23-2,321.42, among others.
The support level is also at around 2,300, marked by December - January local highs. On the other hand, the nearest important level of resistance is now at around 2,350-2,360, marked previous level of support. The next resistance level is at 2,390-2,400, marked by all-time high.
We can see some short-term volatility following four-month-long rally off last year's November low at around 2,100. Is this a topping pattern before downward reversal? The uptrend accelerated on March 1 and it looked like a blow-off top pattern accompanied by some buying frenzy. The S&P 500 index trades at its five-month-long upward trend line, as we can see on the daily chart:
Expectations before the opening of today's trading session are slightly positive, with index futures currently between 0.0% and +0.2% vs. their yesterday's closing prices. The European stock market indexes have been mixed so far. Investors will now wait for some economic data announcements: Initial Claims at 8:30 a.m., New Home Sales at 10:00 a.m.
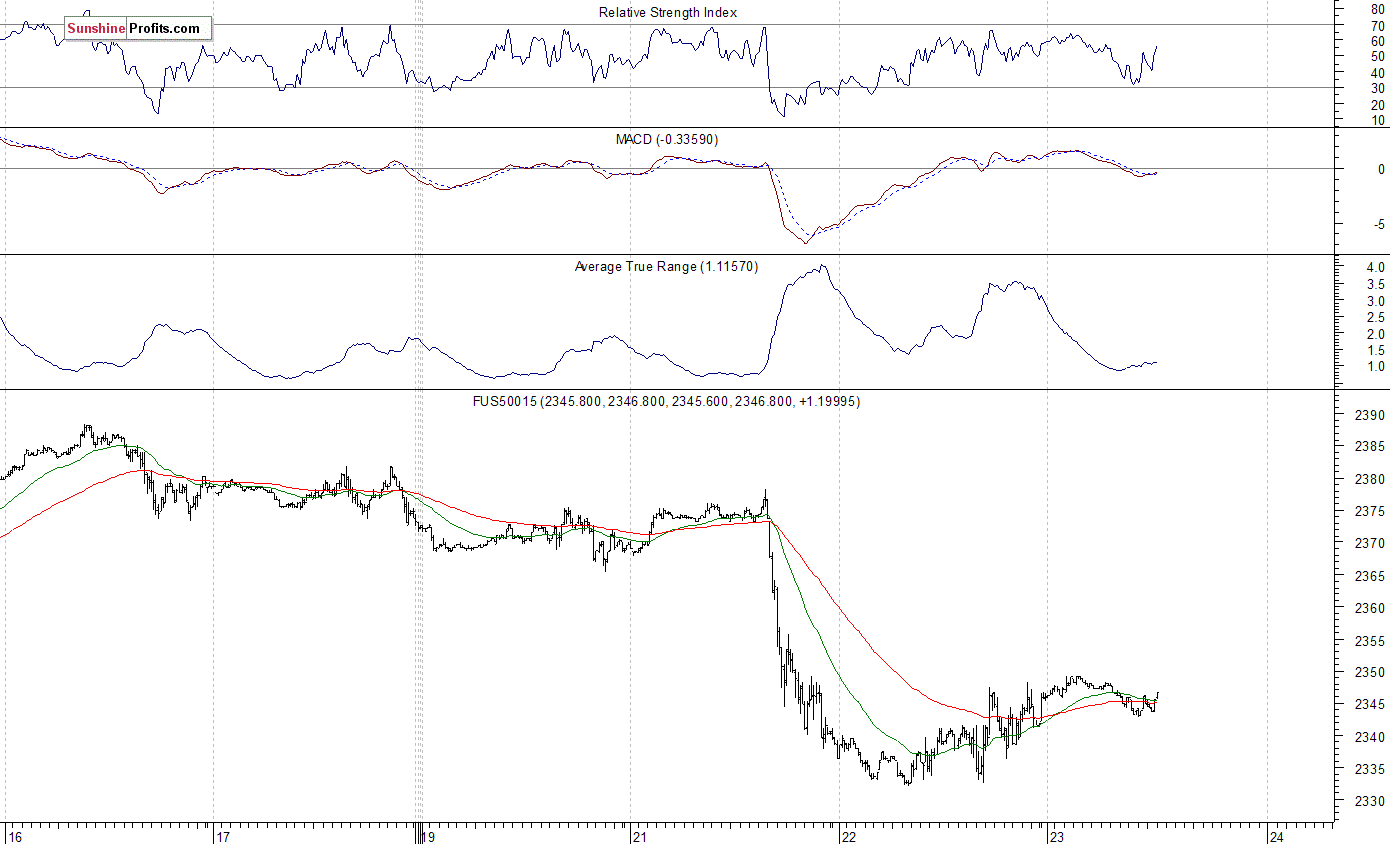
The market expects that New Home Sales were 560,000 in February, slightly up from last month's number of 555,000. The S&P 500 futures contract trades within an intraday consolidation, following overnight move down. It has retraced some of its yesterday's rebound off support level at 2,330-2,335.
The nearest important level of resistance is at around 2,350, marked by short-term local high. The next resistance level is at 2,360-2,365, marked by previous consolidation. On the other hand, support level is at 2,330, and the next support level remains at 2,300-2,320, among others. The market trades within a short-term downtrend, following breakdown below recent trading range. Will it continue lower, or is this just a quick downward correction within five-month-long rally off November low?
The technology NASDAQ 100 futures contract was relatively weaker than the broad stock market on Wednesday. However, it has retraced some of its weakness yesterday. The market has reached the resistance level of 5,380-5,400. The nearest important level of support is now at around 5,350, marked by some short-term fluctuations. The next support level remains at 5,300-5,320, as the 15-minute chart shows:
Concluding, the broad stock market retraced some of its Tuesday's decline yesterday, as the S&P 500 index gained 0.2%. Is this just a quick rebound before another leg down or upward reversal? There have been no confirmed short-term positive signals so far. We still can see medium-term overbought conditions along with negative technical divergences .
Therefore, we continue to maintain our speculative short position (opened on February 15 at 2,335.58 - opening price of the S&P 500 index). Stop-loss level is at 2,410 and potential profit target is at 2,200 (S&P 500 index). You can trade S&P 500 index using futures contracts (S&P 500 futures contract - SP, E-mini S&P 500 futures contract - ES) or an ETF like the SPDR S&P 500 ETF (NYSE:SPY) - SPY.
It is always important to set some exit price level in case some events cause the price to move in the unlikely direction. Having safety measures in place helps limit potential losses while letting the gains grow.
To summarize: short position in S&P 500 index is justified from the risk/reward perspective with the following entry prices, stop-loss orders and profit target price levels:
S&P 500 index - short position: profit target level: 2,200; stop-loss level: 2,410
S&P 500 futures contract (March) - short position: profit target level: 2,197; stop-loss level: 2,407
SPY ETF (SPDR S&P 500 (MX:SPY), not leveraged) - short position: profit target level: $220; stop-loss level: $241
SDS ETF (ProShares UltraShort S&P500, leveraged: -2x) - long position: profit target level: $15.47; stop-loss level: $12.98
Trading in financial instruments and/or cryptocurrencies involves high risks including the risk of losing some, or all, of your investment amount, and may not be suitable for all investors. Prices of cryptocurrencies are extremely volatile and may be affected by external factors such as financial, regulatory or political events. Trading on margin increases the financial risks.
Before deciding to trade in financial instrument or cryptocurrencies you should be fully informed of the risks and costs associated with trading the financial markets, carefully consider your investment objectives, level of experience, and risk appetite, and seek professional advice where needed.
Fusion Media would like to remind you that the data contained in this website is not necessarily real-time nor accurate. The data and prices on the website are not necessarily provided by any market or exchange, but may be provided by market makers, and so prices may not be accurate and may differ from the actual price at any given market, meaning prices are indicative and not appropriate for trading purposes. Fusion Media and any provider of the data contained in this website will not accept liability for any loss or damage as a result of your trading, or your reliance on the information contained within this website.
It is prohibited to use, store, reproduce, display, modify, transmit or distribute the data contained in this website without the explicit prior written permission of Fusion Media and/or the data provider. All intellectual property rights are reserved by the providers and/or the exchange providing the data contained in this website.
Fusion Media may be compensated by the advertisers that appear on the website, based on your interaction with the advertisements or advertisers.