The SPX:VIX Ratio: Bulls Will Need To Hold Above 150.00
Candy Matheson | Mar 23, 2015 01:21AM ET
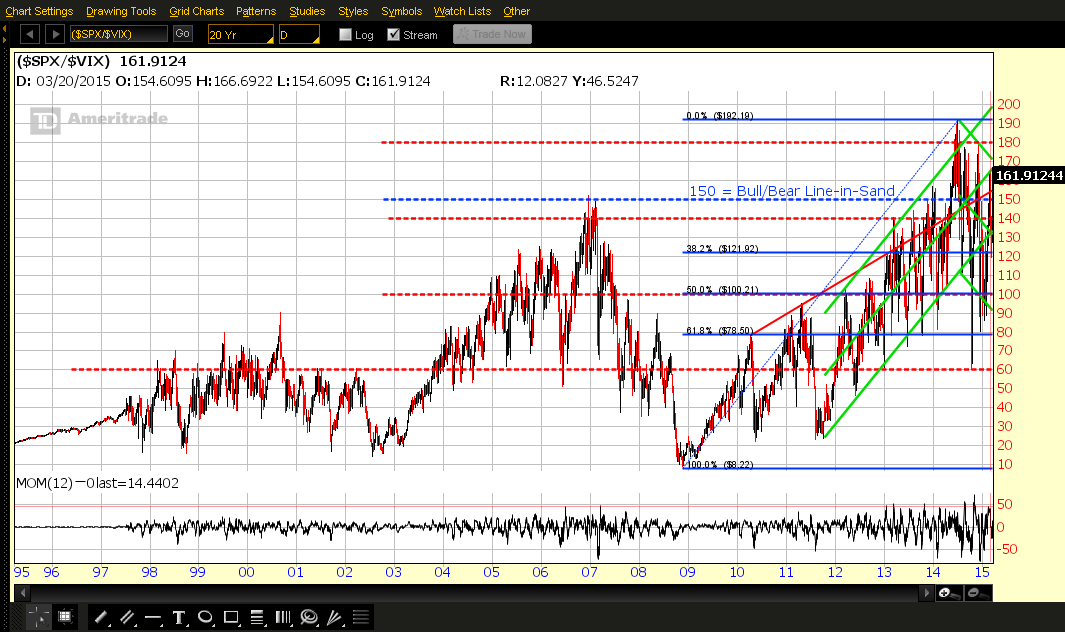
As I mentioned in my post on February 24th, 150.00 is the Bull/Bear Line-in-Sand level for the SPX:VIX ratio, as shown on the updated Daily ratio chart below.
At the moment, price is back above this level, after bouncing in between 160.00ish and 120.00ish since that last post.
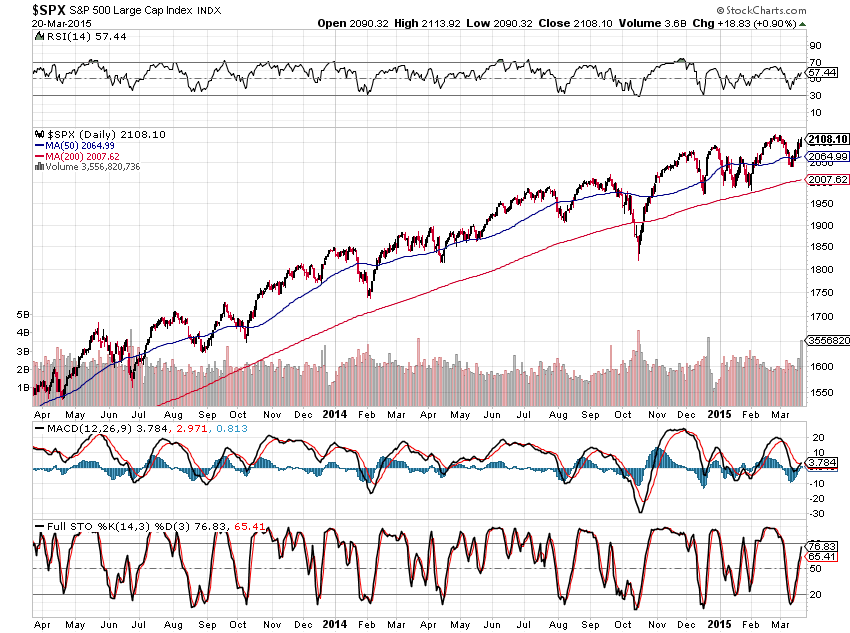
The following 2-year Daily chart of the SPX shows a high-volume spike made this past Friday. Generally speaking, each time such a volume spike occurred during this time frame, it has been followed by, either, an immediate reversal, or one shortly thereafter. If history is to repeat itself, I'd say the SPX is due to reverse to the downside soon.
We may see clues of such an event develop in the SPX:VIX ratio chart above. Bulls will need to hold price above 150.00, plus we'll need to see the price of the Momentum indicator hold above the zero level. A drop and hold below those levels may see the Bears re-take control of the SPX and send it below its last swing low to, potentially, re-test the 200-day moving average, or lower.
Additionally, further clues as to direction may be found in the last update I've written in my post entitled "Major World Index Poised for Breakout or Failure?"
Trading in financial instruments and/or cryptocurrencies involves high risks including the risk of losing some, or all, of your investment amount, and may not be suitable for all investors. Prices of cryptocurrencies are extremely volatile and may be affected by external factors such as financial, regulatory or political events. Trading on margin increases the financial risks.
Before deciding to trade in financial instrument or cryptocurrencies you should be fully informed of the risks and costs associated with trading the financial markets, carefully consider your investment objectives, level of experience, and risk appetite, and seek professional advice where needed.
Fusion Media would like to remind you that the data contained in this website is not necessarily real-time nor accurate. The data and prices on the website are not necessarily provided by any market or exchange, but may be provided by market makers, and so prices may not be accurate and may differ from the actual price at any given market, meaning prices are indicative and not appropriate for trading purposes. Fusion Media and any provider of the data contained in this website will not accept liability for any loss or damage as a result of your trading, or your reliance on the information contained within this website.
It is prohibited to use, store, reproduce, display, modify, transmit or distribute the data contained in this website without the explicit prior written permission of Fusion Media and/or the data provider. All intellectual property rights are reserved by the providers and/or the exchange providing the data contained in this website.
Fusion Media may be compensated by the advertisers that appear on the website, based on your interaction with the advertisements or advertisers.