Uncertainty Looms Over The Market In Near-Term
Andre Gratian | Oct 07, 2019 01:54AM ET
Current Position of the Market
- SPX: Long-term trend – There are no clear signs that the bull market is over.
- Intermediate trend – We have started a correction of intermediate nature.
- Short-term trend analysis – Done on a daily basis with the help of hourly charts. It is an important adjunct to the analysis of daily and weekly charts which discusses the course of longer market trends.
Market Overview
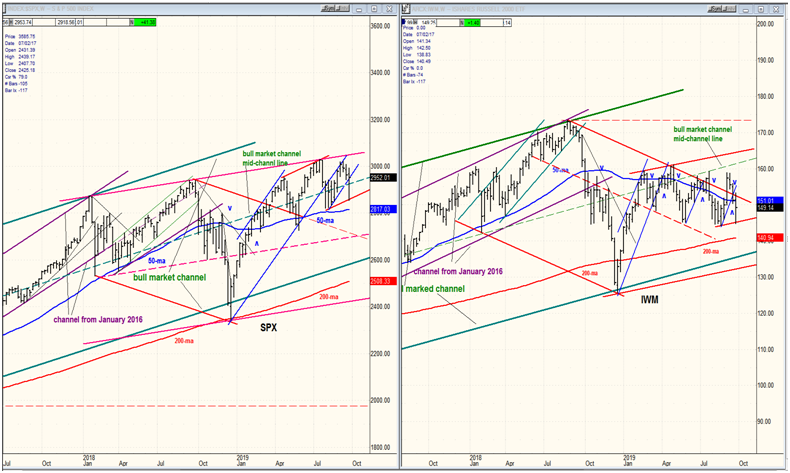
After a plunge of 137 points to 2856 early in the week, SPX staged a strong two-day rally back to 2952 to end the week with a minor loss instead of something much larger, had the 40-week cycle continued to push prices lower. The question to ask is whether or not the 40-week cycle has now made its low, which is possible since we are within the time frame allotted to it. But this will require confirmation since we know that, historically, this cycle does not always measure an exact 40 weeks from low to low. There are times when it has deviated by as many as 6 weeks. We can achieve a reasonable perspective of what could happen next by observing the weekly charts of SPX and IWM which appear below.
The analysis can be kept fairly simple! 1) Since its all-time high of 7/21/19, SPX has made a lower high, but has not yet made a lower low. Consequently, until it makes either a higher high or a lower low, we’ll call its intermediate trend neutral. 2) On the other hand, IWM has remained well below its 8/18 high, and it has been making a sequence of lower lows and lower highs since its secondary high on 05/19, which places it in a mild, but definite downtrend since the latter date. On Friday, SPX rallied about two-thirds of its weekly range, while IWM rebounded only about half and, overall, remains much weaker than SPX. Until the relationship between the two indexes begins to favor IWM, the risk of more market weakness in the weeks ahead remains prevalent.
SPX Daily Chart
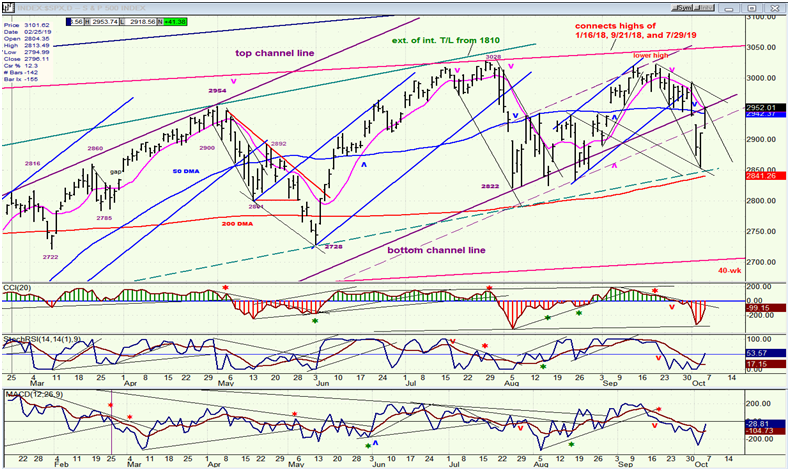
The daily chart is not as neutral as the weekly chart. Last week, SPX punched through the channel line which it had violated earlier, but it met with support just above the 200-dma and rallied all the way back to the broken channel line. That puts it at an important juncture. If it continues its rally inside the channel and moves above 3000, it will be back in a short-term uptrend which will give the bulls another chance to extend the market’s long-term bullish trend. If it fails to do so and resumes its downtrend with a break below the 200-dma and 2822, it will have turned its trend to the downside with a lower low and an initial objective of 2750. A move below 2720 would place the index in a protracted downtrend which should last into next year.
It is important to note that last week’s rally can be attributed to several non-technical factors including a renewal of the trade talks which will take place next Thursday, bullish comments by the Fed chairman which did not rule out another rate cut by the end of the month, and focus on the “goldilocks” Friday jobs report. Also important from a technical standpoint, is that all three oscillators also had good rallies, but they stopped short of giving buy signals.
Needless to say, next week will provide us with an important gauge of the market mood.
SPX Hourly Chart
Looking at the hourly chart, we can see that the rally not only stopped at the channel line, but also at the 200-hr MA, which also marks the base of a resistance pattern which extends all the way to the recent high of 3022. Moving above that high would continue the uptrend which started at 2822 in early August, and directly challenge the July all-time high which is not all that far above. It would also muddy the analysis which sees a good probability that an important top is under construction.
I should point out that the three oscillators are all bullish and do not show any negative divergence; and that on Friday the index closed above its 50-hr MA as well as above its 50-dma!
UUP (Dollar ETF) Daily
UUP remains in a long-term, intermediate, and short-term uptrend. Last week saw a new high followed by a small pull-back to the bottom of the short-term green channel. The prognosis remains the same as it was last week, i.e. a clean break outside of the green channel would probably be followed by a continued correction to the vicinity of the blue lower channel line.
Gold Miners ETF (GDX) Weekly
GDX (NYSE:GDX) has essentially held its previous short-term low, but could still push a little lower to complete a 50% retracement of its last uptrend. A clean break above 29.00 would probably lead to a new high, but the base that it is forming at the current level does not look quite complete.
CCG (Canopy Growth) Daily
I have reverted to Canopy Growth Corp (NYSE:CGC) as the best specimen of the cannabis industry. Recent signs of deceleration in the chart and oscillators could be premature. Let’s give it a little more time.
United States Brent Oil (BNO) Fund Daily
United States Brent Oil (NYSE:BNO) continues to correct and last week’s rally looked more like a replica of IWM than of SPX. No sign of strength!
Summary
Last week‘s market action brought some uncertainty to the near-term market direction. We’ll have a better sense of where it wants to go after next week.
Trading in financial instruments and/or cryptocurrencies involves high risks including the risk of losing some, or all, of your investment amount, and may not be suitable for all investors. Prices of cryptocurrencies are extremely volatile and may be affected by external factors such as financial, regulatory or political events. Trading on margin increases the financial risks.
Before deciding to trade in financial instrument or cryptocurrencies you should be fully informed of the risks and costs associated with trading the financial markets, carefully consider your investment objectives, level of experience, and risk appetite, and seek professional advice where needed.
Fusion Media would like to remind you that the data contained in this website is not necessarily real-time nor accurate. The data and prices on the website are not necessarily provided by any market or exchange, but may be provided by market makers, and so prices may not be accurate and may differ from the actual price at any given market, meaning prices are indicative and not appropriate for trading purposes. Fusion Media and any provider of the data contained in this website will not accept liability for any loss or damage as a result of your trading, or your reliance on the information contained within this website.
It is prohibited to use, store, reproduce, display, modify, transmit or distribute the data contained in this website without the explicit prior written permission of Fusion Media and/or the data provider. All intellectual property rights are reserved by the providers and/or the exchange providing the data contained in this website.
Fusion Media may be compensated by the advertisers that appear on the website, based on your interaction with the advertisements or advertisers.