5 Macro Charts Show What's Bullish And Bearish Now
Callum Thomas | Jan 17, 2017 01:21AM ET
Here's the regular 5 macro technical charts (going as far as individual commodities, currencies, bonds, and sectors, as well as the rest of the major indexes and benchmarks). No comments on anything except the technical/price developments (albeit we will typically cover the broader case in the Weekly Macro Themes where the technical and fundamental set up produce a compelling investment idea).
Even if you're not technical analysis minded, it's a useful way to keep on top of trends in some of the main financial markets and as a prompt for further investigation...
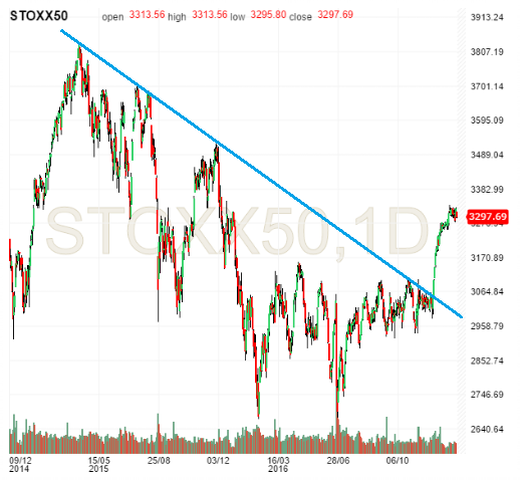
1. Euro Stoxx - One test passed...
- The Euro Stoxx 50 has passed one test in making a fairly convincing breakout from the down trend line established from the peak in 2015.
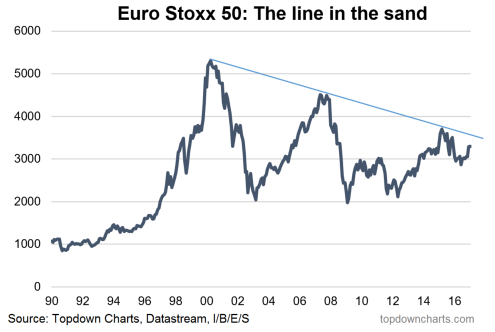
- The next test comes by looking at the monthly chart which shows an even longer term down trend line established from 2000 and tested 3 times; one would be right to ask will this time be different ?
- -The 50 and 200 day moving averages are putting in strong up-trend signals, but 3300 is an important level.
Overall technical view: Bullish bias, caution should be applied as the long term trend line is approached, but an upside breakout of the longer term trend line will be very bullish medium-term.
2. Copper - Bull flag
- After an upside breakout from a symmetrical triangle, as previously flagged copper is now undergoing another critical point.
- The latest pattern to form is a bullish flag formation. Typically this is a continuation pattern and using the measure rule of the flag being crica half way up the "pole" upside would be as much as 20%.
- The other implication of an upside breakout from the bull flag would be a more clear upside breakout of the down trend of the past 5 years; it would also place the price around the previous support levels around 6800-7000.
Overall technical view: Bullish bias, trigger is an upside break of the bull flag.
3. GBPUSD - Brexitdown, er, I mean Breakdown
- GBP/USD broke down through support of 1.21
- Previously, breaks of support have been followed by significant moves e.g. 1.41 and 1.29 (with the exception of the false breakdown through 1.41 in February 2016).
- At present the daily RSI is not yet oversold so it's too soon to call a bottom, but as pointed out previously, speculative futures positioning has been stretched to the short side for some time.
Overall technical view: Bearish bias, bears watch for any signs of a false breakout or oversold conditions.
4. Coffee - Bottom is in, now what?
- Bullish divergence (lower low on price vs higher low on RSI) concluded with a bottom in the coffee ETF (NYSE:JO).
- Aside from a breakaway gap, price has broken up through the 200 day moving average.
- But coffee now faces two key tests; can it break up through the 50 day moving average? And can it break through resistance of 21.5?
Overall technical view: Bullish bias but the key trigger is a solid break of the 50dma AND support of 21.5
5. Korea - Ascending the triangles
- iShares MSCI South Korea Capped (NYSE:EWY), the South Korea ETF, saw an upside breakout of a large ascending triangle on the weekly chart in 2016.
- Subsequently the breakout failed and what appears to be yet another ascending triangle is forming.
- We're left with two key trend lines: 1. Resistance of 58, and 2. Support of the upward sloping trend line in place from mid 2015. With the 50 and 200 day moving averages showing bullish trend signals, a bullish bias is warranted.
Overall technical view: Bullish, 58 is the long side trigger, 54 the short side.
Trading in financial instruments and/or cryptocurrencies involves high risks including the risk of losing some, or all, of your investment amount, and may not be suitable for all investors. Prices of cryptocurrencies are extremely volatile and may be affected by external factors such as financial, regulatory or political events. Trading on margin increases the financial risks.
Before deciding to trade in financial instrument or cryptocurrencies you should be fully informed of the risks and costs associated with trading the financial markets, carefully consider your investment objectives, level of experience, and risk appetite, and seek professional advice where needed.
Fusion Media would like to remind you that the data contained in this website is not necessarily real-time nor accurate. The data and prices on the website are not necessarily provided by any market or exchange, but may be provided by market makers, and so prices may not be accurate and may differ from the actual price at any given market, meaning prices are indicative and not appropriate for trading purposes. Fusion Media and any provider of the data contained in this website will not accept liability for any loss or damage as a result of your trading, or your reliance on the information contained within this website.
It is prohibited to use, store, reproduce, display, modify, transmit or distribute the data contained in this website without the explicit prior written permission of Fusion Media and/or the data provider. All intellectual property rights are reserved by the providers and/or the exchange providing the data contained in this website.
Fusion Media may be compensated by the advertisers that appear on the website, based on your interaction with the advertisements or advertisers.