5 Charts: EM Equity Breakout; Bullish Base Metals; Oil's Coil
Callum Thomas | Feb 14, 2017 12:37AM ET
Here's the regular 5 macro technical charts (going as far as individual commodities, currencies, bonds, and sectors, as well as the rest of the major indexes and benchmarks). No comments on anything except the technical/price developments (albeit we will typically cover the broader case in the Weekly Macro Themes where the technical and fundamental set up produce a compelling investment idea). Even if you're not technical analysis minded it's a useful way to keep on top of trends in some of the main financial markets and as a prompt for further investigation...
In this edition we look at a potential short-term top in European Equities, an initial breakout for Emerging Market Equities, the upward pressure on Japanes Government Bond Yields, the upside breakout for Base Metals, and the ongoing volatility crunch in Crude Oil as it meets with positive seasonality.
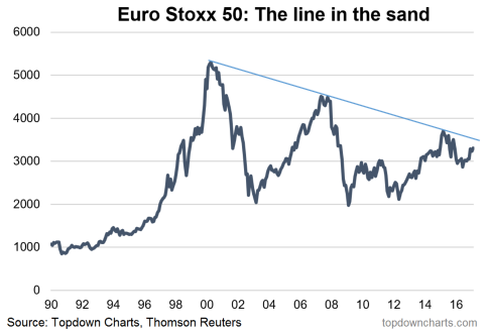
1. European Equities - Failure Before the Test
- The longer term chart of the Euro Stoxx 50, which appeared in the 18th November edition of the Weekly Macro Themes , shows the line in the sand and the key test for the index.
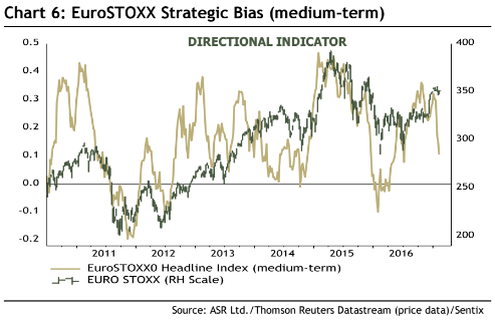
- Yet the second chart shows Sentix strategic bias sentiment rolling over for European equities.
- Thus it appears at this point there is a risk that European equities have failed the test before even trying.
Overall technical view: Cautious bias short-term
2. Emerging Market Equities - Breakout
- I previously noted Emerging Market equities (via iShares MSCI Emerging Markets ETF (NYSE:EEM)) were facing a test, and preliminary results show it has passed that test; final results are pending (a break of 39).
- Relative performance vs the S&P 500 (via SPDR S&P 500 ETF (NYSE:SPY)) has shaken off the downtrend, but has yet to convincingly confirm.
- Minor upside resistance comes at 39, whereas major upside resistance comes at 42.
Overall technical view: Bullish
3. Japanese Government Bonds - Lines and Islands
- Japanese government bond yields continue to see clear upward pressure as the 10-year yield looks to close the gap from January 2016.
- The key resistance point is 0.10% and for now the floor has been established at 0.05%
- Looking at the longer term trend line there remains space for it to run before testing the trend line (let alone breaking out, which would still be a tougher ask)
Overall technical view: Bullish bias (on yields - i.e. bearish Japanese government bonds).
4. Base Metals - Breakout
- Base metals (via PowerShares DB Base Metals (NYSE:DBB)) are on the move again, with a potential breakaway gap spotted.
- Relative performance also continues to trend upward which is a positive sign for sector specific strength.
- Recent test of the 50dma shows a market in a solid uptrend, and echoes the copper charts from last week.
Overall technical view: Bullish (Risk management note: resistance is now support).
5. Crude Oil - Seasonal Bias
- The volatility compression continues in crude oil as the price coils up within the unusually tight range, as noted in the commodities special edition of the Weekly Macro Themes.
- -Average true range and bollinger bandwidth have tightened up to extreme lows, which to me suggests a high chance of a near term breakout, and likely an explosive one at that.
- -Seasonality is starting to turn positive, which will bias the breakout expectations to the upside.
Overall technical view: Bullish bias on seasonality, but wait for the breakout.
Trading in financial instruments and/or cryptocurrencies involves high risks including the risk of losing some, or all, of your investment amount, and may not be suitable for all investors. Prices of cryptocurrencies are extremely volatile and may be affected by external factors such as financial, regulatory or political events. Trading on margin increases the financial risks.
Before deciding to trade in financial instrument or cryptocurrencies you should be fully informed of the risks and costs associated with trading the financial markets, carefully consider your investment objectives, level of experience, and risk appetite, and seek professional advice where needed.
Fusion Media would like to remind you that the data contained in this website is not necessarily real-time nor accurate. The data and prices on the website are not necessarily provided by any market or exchange, but may be provided by market makers, and so prices may not be accurate and may differ from the actual price at any given market, meaning prices are indicative and not appropriate for trading purposes. Fusion Media and any provider of the data contained in this website will not accept liability for any loss or damage as a result of your trading, or your reliance on the information contained within this website.
It is prohibited to use, store, reproduce, display, modify, transmit or distribute the data contained in this website without the explicit prior written permission of Fusion Media and/or the data provider. All intellectual property rights are reserved by the providers and/or the exchange providing the data contained in this website.
Fusion Media may be compensated by the advertisers that appear on the website, based on your interaction with the advertisements or advertisers.