Trend Followers Should Watch These Key Levels
David Fabian | Apr 01, 2015 07:08AM ET
Following the trends of the market is often easier said than done. When things are going your way, it’s natural to become enamored with the “trend is your friend” phraseology that jives with your directional bias. Nevertheless, there will always be periods of volatility that test your resolve and reaffirm the notion that investing is anything but easy.
If you are new to trend following, I wrote an article last November titled: 3 Reasons to Love and Hate Stock Market Trends . This may be worth a quick study to become further acquainted with the benefits and risks of this style of technical analysis.
Bringing this concept forward to more current and actionable intelligence, I have been examining a chart of the SPDR S&P 500 ETF (ARCA:SPY) on the last day of the quarter (March 31). Several key points stand out to me as I overlay various trend lines and obvious support levels that may be tested over the next several months.
The 1-year chart below includes 50, 125, and 200-day simple moving averages as guideposts to understanding the historical price trend over various time frames. As you can see, all three of these averages are continuing to slope higher, which bodes well for bullish directional momentum despite the volatility over the last quarter.
The 125-day moving average (smooth green line) has been a robust area of support during the forceful down moves in December and January. This intermediate-term trend line will be an important level to watch as we make our way into April and May as well. Any sell-offs that slip convincingly below this level may warrant additional cautionary moves within your portfolio.
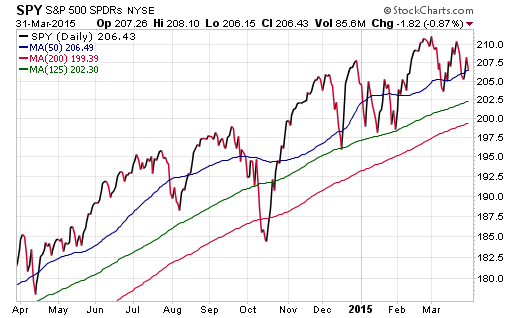
One nexus of potential discomfort for trend followers will be the 200-day moving average on SPY. This smooth red line is nearing the $200 price level, which is above the lows of the year established in January. From a risk management standpoint, some may prefer to stick with a traditional trend following model that sells on a dip below the long-term average. Others may be more inclined to wait for a break below those January (or even December) lows before they consider taking risk off the table.
There is no right or wrong answer when it comes to making the tough decisions on managing risk in your investment portfolio. Some prefer to be more conservative in selling under tight circumstances, which can lead to loss of upside potential during a whipsaw. Conversely, those that give the market too much leash will find themselves wishing they had sold earlier to avoid a steep drop.
Either way, evaluating this technical data may help in determining a game plan for your stock allocations as we make our way into a seasonally tumultuous period near the middle of the year. Reducing volatility should be a primary consideration at this stage of the market cycle. That may include strategic shifts in asset allocation, security selection, or managing risk using a sell discipline.
Disclosure : FMD Capital Management, its executives, and/or its clients may hold positions in the ETFs, mutual funds or any investment asset mentioned in this article. The commentary does not constitute individualized investment advice. The opinions offered herein are not personalized recommendations to buy, sell or hold securities.
Original post
![]()
Trading in financial instruments and/or cryptocurrencies involves high risks including the risk of losing some, or all, of your investment amount, and may not be suitable for all investors. Prices of cryptocurrencies are extremely volatile and may be affected by external factors such as financial, regulatory or political events. Trading on margin increases the financial risks.
Before deciding to trade in financial instrument or cryptocurrencies you should be fully informed of the risks and costs associated with trading the financial markets, carefully consider your investment objectives, level of experience, and risk appetite, and seek professional advice where needed.
Fusion Media would like to remind you that the data contained in this website is not necessarily real-time nor accurate. The data and prices on the website are not necessarily provided by any market or exchange, but may be provided by market makers, and so prices may not be accurate and may differ from the actual price at any given market, meaning prices are indicative and not appropriate for trading purposes. Fusion Media and any provider of the data contained in this website will not accept liability for any loss or damage as a result of your trading, or your reliance on the information contained within this website.
It is prohibited to use, store, reproduce, display, modify, transmit or distribute the data contained in this website without the explicit prior written permission of Fusion Media and/or the data provider. All intellectual property rights are reserved by the providers and/or the exchange providing the data contained in this website.
Fusion Media may be compensated by the advertisers that appear on the website, based on your interaction with the advertisements or advertisers.