Treasury Yields: A Long-Term Perspective
Jill Mislinski | Aug 13, 2017 03:11AM ET
Let's have a look at a long-term perspective on Treasury yields as of today's close. The chart below shows the 10-Year Constant Maturity yield since 1962 along with the Federal Funds Rate (FFR) and inflation. The range has been astonishing. The stagflation that set in after the 1973 Oil Embargo was finally ended after Paul Volcker raised the FFR to 20.06%.
Last year was a remarkable one for yields. The 10-Year note hit its historic closing low of 1.37% in July and then rose 123 BPs to its 2016 closing high of 2.60% in mid-December. The yield on the 10-year note to date has dropped to 2.25% as of today's close.
Now let's overlay the S&P 500 to see historical pattern of equities versus treasuries. This is a nominal chart, which significantly distorted the real value of both yields and equity prices.
Here's the same chart with the S&P 500 and 10-year yields adjusted for inflation using the Consumer Price Index. The impact of stagflation becomes much clearer. We can better understand the severity of the decline in equities from the mid-1960s to the bottom in 1982. And we can also see why high yields can be deceptive in periods of double-digit inflation.
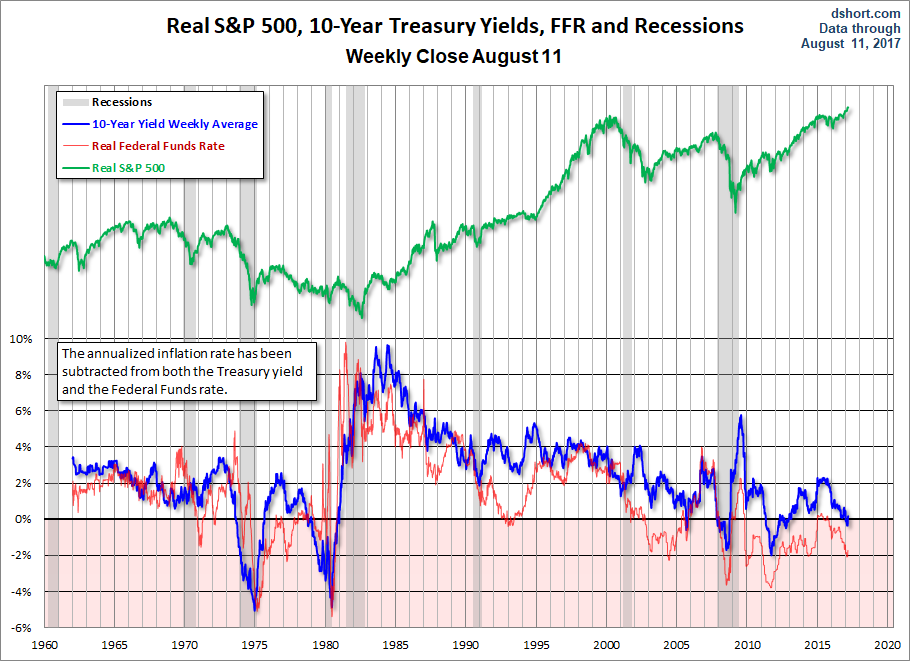
The most interesting series in the charts is the FFR red line. We can see how the Fed has used rate to control inflation, accelerate growth and, when needed, apply the brakes. Unfortunately, the FFR has been virtually zero since December 2008, so it is no longer available as a tool to stimulate the economy. Incidentally, we've annotated the top chart with the tenures of the last three Fed chairmen so we can see who was managing the various FFR cycles since the summer of 1979.
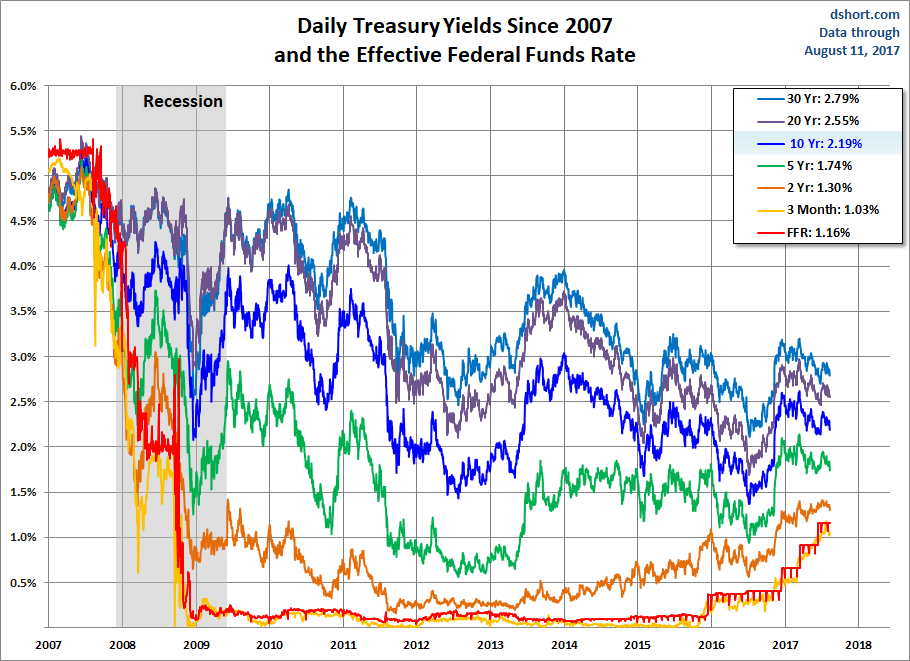
The next chart is based on daily data and adds some additional Treasuries for a close look at yields since 2007.
Here is a closer look at the trend in the 10-year, this time using a log scale vertical axis for a more accurate reading of the relative changes over time. We've added a trendline using the highs since the end of the decade of stagflation. The trendline helps us see the substantial impact of the Financial Crisis and Fed intervention with zero interest rate policy (ZIRP) and asset purchases.
Now let's see the 10-year against the S&P 500 with some notes on Fed intervention.
We update the long-term charts periodically and the last chart more frequently, depending on yield volatility.
Trading in financial instruments and/or cryptocurrencies involves high risks including the risk of losing some, or all, of your investment amount, and may not be suitable for all investors. Prices of cryptocurrencies are extremely volatile and may be affected by external factors such as financial, regulatory or political events. Trading on margin increases the financial risks.
Before deciding to trade in financial instrument or cryptocurrencies you should be fully informed of the risks and costs associated with trading the financial markets, carefully consider your investment objectives, level of experience, and risk appetite, and seek professional advice where needed.
Fusion Media would like to remind you that the data contained in this website is not necessarily real-time nor accurate. The data and prices on the website are not necessarily provided by any market or exchange, but may be provided by market makers, and so prices may not be accurate and may differ from the actual price at any given market, meaning prices are indicative and not appropriate for trading purposes. Fusion Media and any provider of the data contained in this website will not accept liability for any loss or damage as a result of your trading, or your reliance on the information contained within this website.
It is prohibited to use, store, reproduce, display, modify, transmit or distribute the data contained in this website without the explicit prior written permission of Fusion Media and/or the data provider. All intellectual property rights are reserved by the providers and/or the exchange providing the data contained in this website.
Fusion Media may be compensated by the advertisers that appear on the website, based on your interaction with the advertisements or advertisers.