Trading Opportunities For FDAX, Dow Jones And Beiersdorf On August 23
Markus Gabel | Aug 23, 2016 08:47AM ET
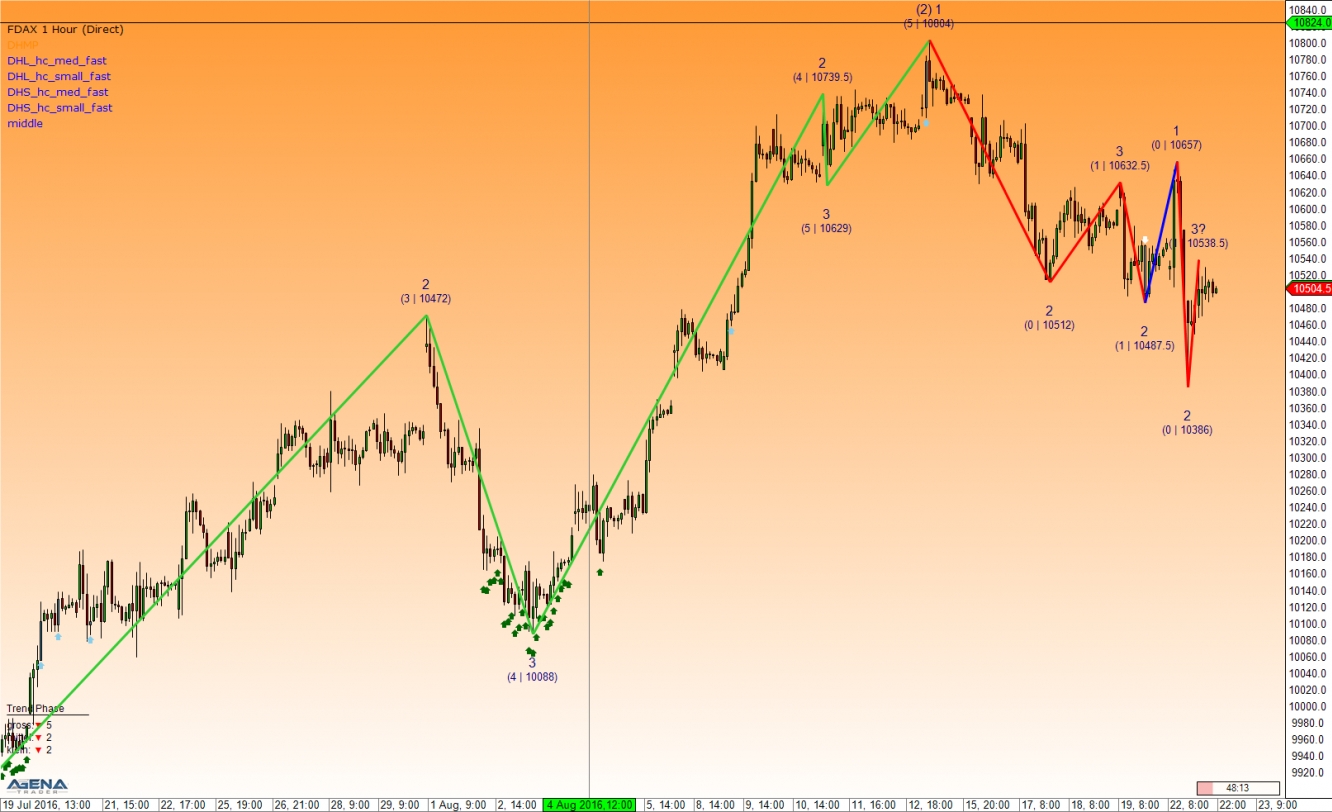
FDAX:
The current correction from the daily chart can be seen in the small trend in the hourly chart by means of a downtrend. At the beginning of the week, the correction zone ran between 10546 and 10632 points. The opening was very weak, and we saw a 30-point down gap on Monday morning. At first it appeared to be a trend continuation, but at the start of the spot market, the buyers increased heftily and broke the trend. But then their strength ran out, meaning that no new trend was able to develop from out of the trend break. Quite the opposite – the DAX collapsed considerably after this, such that it currently looks like a downtrend will be formed once more.
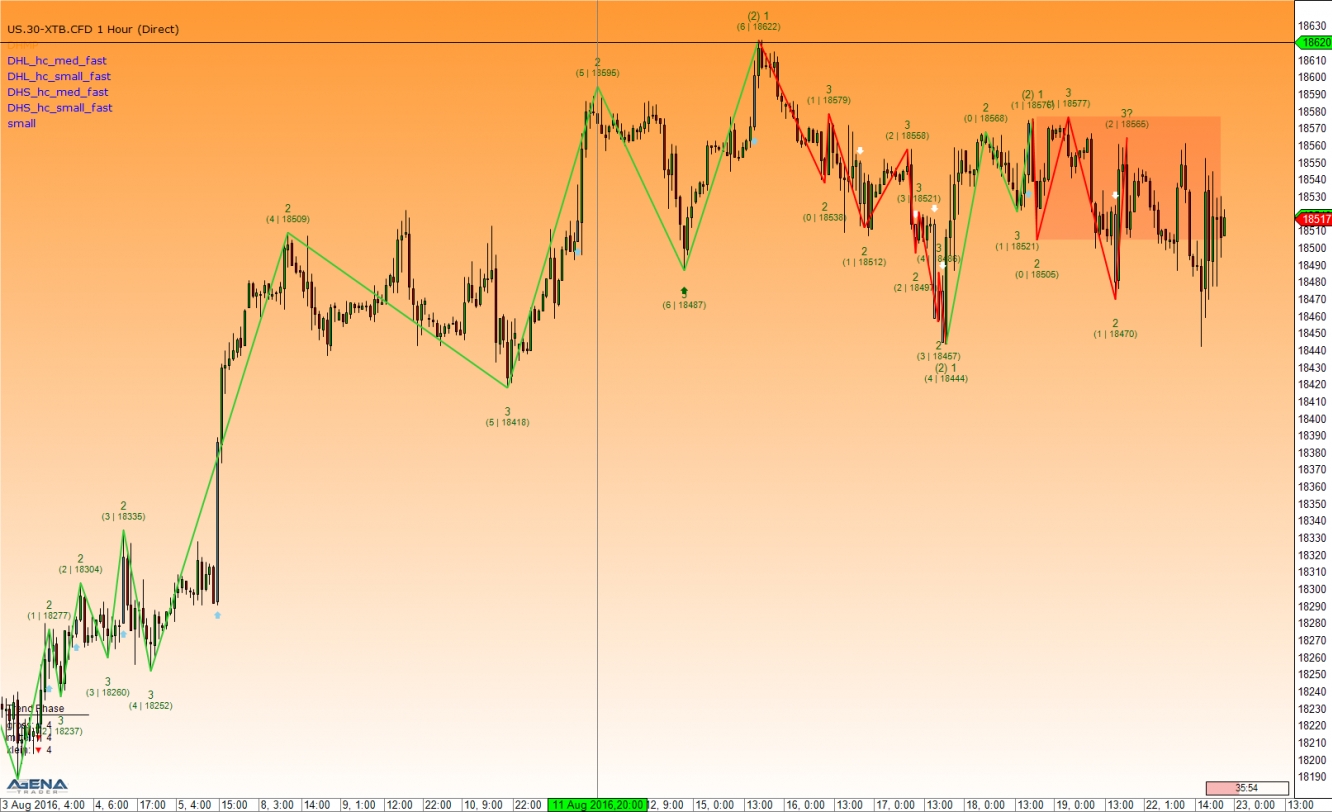
Dow Jones 30:
In the US index, one can see the current uncertainty very well in the hourly chart. The trends are constantly and swiftly switching in the small trend size. The current trend is facing downwards once more, and the valid correction zone stretches between 18505 and 18577 points on the upper side. Despite the recurring attempts to continue the trend on downwards, it has so far not been possible. However, as long as there is no closing price above the red box, one has to assume that the downtrend can proceed at any time.
Beiersdorf:
Beiersdorf AG (DE:BEIG) is a leading international branded goods company that is active in the cosmetics sector and in the production of adhesive tapes. The company was founded with its headquarters in Hamburg, in the year 1882. Currently, this well-established company is able to assert itself pretty well in the market environment. From the perspective of the short-term hourly chart, we see a valid upward trend with a correction zone between €82.32 and €75 on the lower side. The price already came back into the green box some time ago, and was able to reach the last point two at €85.62, but not overcome it. That is why the green zone also remained intact. Now the price is once again on its way to this box, and the DowHow signals are appearing. As soon as the price has stabilised itself a little, one can consider a long trade.
IMPORTANT NOTE:
Exchange transactions are associated with significant risks. Those who trade on the financial and commodity markets must familiarize themselves with these risks. Possible analyses, techniques and methods presented here are not an invitation to trade on the financial and commodity markets. They serve only for illustration, further education, and information purposes, and do not constitute investment advice or personal recommendations in any way. They are intended only to facilitate the customer’s investment decision, and do not replace the advice of an investor or specific investment advice. The customer trades completely at his or her own risk.
Trading in financial instruments and/or cryptocurrencies involves high risks including the risk of losing some, or all, of your investment amount, and may not be suitable for all investors. Prices of cryptocurrencies are extremely volatile and may be affected by external factors such as financial, regulatory or political events. Trading on margin increases the financial risks.
Before deciding to trade in financial instrument or cryptocurrencies you should be fully informed of the risks and costs associated with trading the financial markets, carefully consider your investment objectives, level of experience, and risk appetite, and seek professional advice where needed.
Fusion Media would like to remind you that the data contained in this website is not necessarily real-time nor accurate. The data and prices on the website are not necessarily provided by any market or exchange, but may be provided by market makers, and so prices may not be accurate and may differ from the actual price at any given market, meaning prices are indicative and not appropriate for trading purposes. Fusion Media and any provider of the data contained in this website will not accept liability for any loss or damage as a result of your trading, or your reliance on the information contained within this website.
It is prohibited to use, store, reproduce, display, modify, transmit or distribute the data contained in this website without the explicit prior written permission of Fusion Media and/or the data provider. All intellectual property rights are reserved by the providers and/or the exchange providing the data contained in this website.
Fusion Media may be compensated by the advertisers that appear on the website, based on your interaction with the advertisements or advertisers.