Trading Major Indices With Time-Frame Analysis
Chris Vermeulen | Apr 18, 2022 04:05PM ET
There are many benefits to utilizing multiple-time-frame analysis in your trading. Some of the standard time frames are monthly, daily, weekly, 4-hour, 1-hour, etc. Longer-term traders may also monitor quarterly and annual charts for clues in market price action.
Some traders use this process to hedge their position using options or an inverse ETF. Others use multi-timeframe analysis to enter new positions by exploiting counter-trend moves within a trending market.
Longer time frames tend to be more reliable, but shorter time frames can reduce risk. Experienced traders who utilize multi-time frames seem to be able to extract the best from all time frames to improve their overall trading efficiency.
Using the SPDR® S&P 500 (NYSE:SPY), we will look at a simple example of this type of time frame analysis utilizing the daily and a 4-hour chart:
In early January 2022, the SPY reacted at 2.618% of its COVID 2020 price drop.
The -14.55% price drop lasted approximately 50 days until the SPY found buying support at 1.618%.
This price drop took out the 4th quarter 2021 SPY low, which was also greater than any other drop that occurred during the 2020-2021 bull rally.
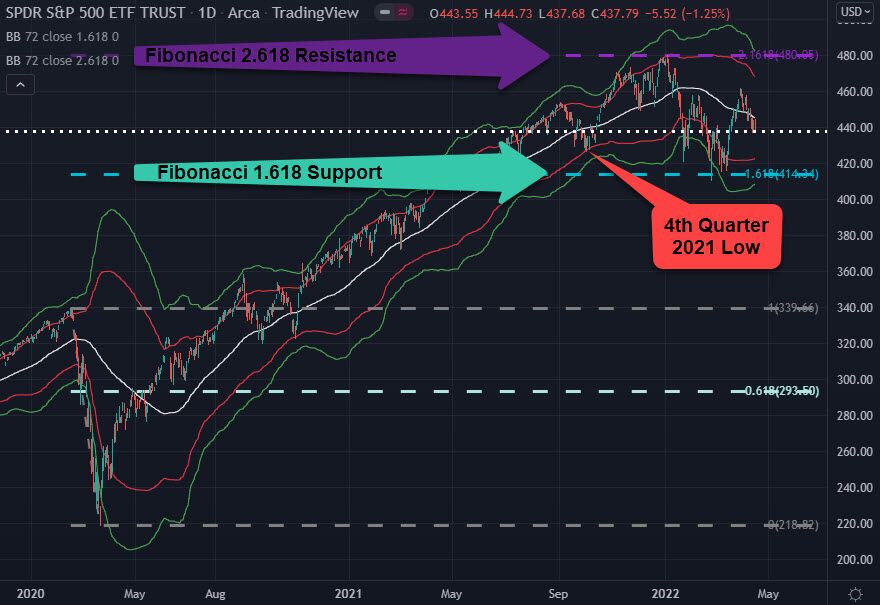
SPY PRICE DROP OF -14.55% VIOLATED ITS Q4 2021 LOW
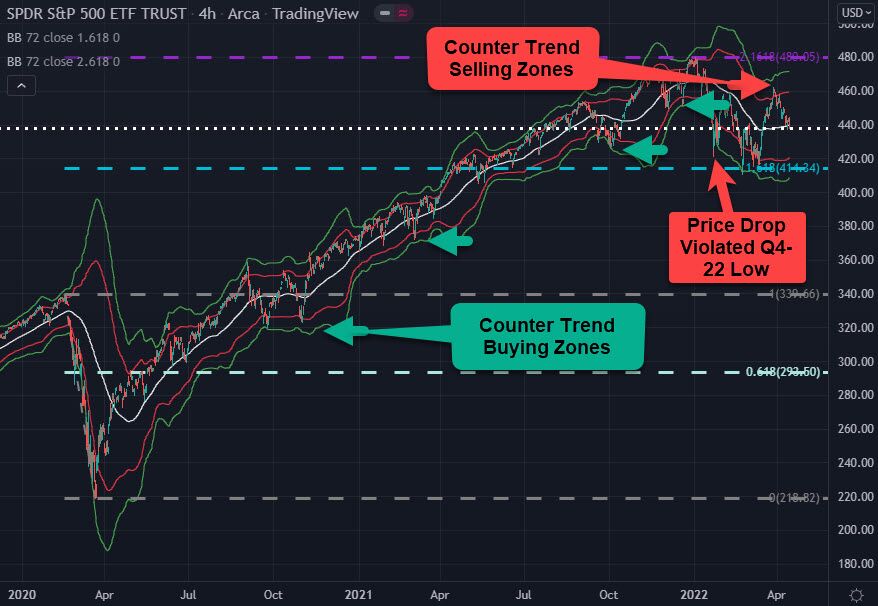
The SPY 4-hour chart shows us the exact same price information as the SPY daily chart. However, in viewing the 4-hour chart, we have 6 times as many bars (1-day equals 24 hours and 24-hours equals 6 4-hour bars).
One example of how this might benefit us is when using a 72-period on a daily chart would represent a calendar quarter. In contrast, a 72-period Bollinger Band on a 4-hour chart equals 12 days or one-half of a month.
As we shorten the timeframe of our chart, it is like we are looking through a magnifying glass which allows us to see our price data in greater detail.
Once the SPY price violated its 4th quarter 2021 low, we were signaled or given a clue that it may be time to liquidate our long positions and consider purchasing an inverse ETF to the SPY like SH.
The 4-hour SPY chart utilizing a 72-period (12-day) Bollinger Band provides us with an excellent opportunity to take profits on our previous long positions by liquidating.
72-period Bollinger Band: 72 4-hour bars equal 288 hours divided by 24, which gives us 12-days.
USING A MULTI TIME FRAME STRATEGY TO PURCHASE AN INVERSE ETF
There are different reasons for utilizing an . A trader may want to hedge their profit in the underlying market, or a trader may want to sell the market short outright. Regardless of the trader’s motive, an inverse ETF can provide additional benefits and flexibility.
As we analyze the SPY and how it violated its previous quarter low, we need to consider that the SPY may be transitioning out of its bull market phase.
An alternative strategy or counter-strategy is to purchase a SPY inverse ETF like SH – ProShares Short S&P 500. The goal of the SH ETF is to be as close as possible to the exact opposite of the S&P500 index (SPY ETF). A simple explanation of the inverse is that when the S&P 500 loses, SH will gain or when the S&P 500 gains SH will lose.
Since SH is an inverse ETF, we want to look for a place to buy SH using a multi-timeframe analysis chart like the 4-hour chart. The 72-period Bollinger Band (12-day) just gave us a ‘Buying Zone.’
Trading in financial instruments and/or cryptocurrencies involves high risks including the risk of losing some, or all, of your investment amount, and may not be suitable for all investors. Prices of cryptocurrencies are extremely volatile and may be affected by external factors such as financial, regulatory or political events. Trading on margin increases the financial risks.
Before deciding to trade in financial instrument or cryptocurrencies you should be fully informed of the risks and costs associated with trading the financial markets, carefully consider your investment objectives, level of experience, and risk appetite, and seek professional advice where needed.
Fusion Media would like to remind you that the data contained in this website is not necessarily real-time nor accurate. The data and prices on the website are not necessarily provided by any market or exchange, but may be provided by market makers, and so prices may not be accurate and may differ from the actual price at any given market, meaning prices are indicative and not appropriate for trading purposes. Fusion Media and any provider of the data contained in this website will not accept liability for any loss or damage as a result of your trading, or your reliance on the information contained within this website.
It is prohibited to use, store, reproduce, display, modify, transmit or distribute the data contained in this website without the explicit prior written permission of Fusion Media and/or the data provider. All intellectual property rights are reserved by the providers and/or the exchange providing the data contained in this website.
Fusion Media may be compensated by the advertisers that appear on the website, based on your interaction with the advertisements or advertisers.