Trading GBP/JPY? A Step-by-Step Guide to Spotting Ranges on the Chart
MarketPulse | Jun 02, 2025 05:07AM ET
Trending markets are popular among traders for their directional clarity. They offer chances to ride momentum, add to positions, or fade extremes. They also give structure and potential for extended moves.
However, range-bound markets are also full of opportunities. They provide clear levels where one knows when he is wrong and help to assess if prices are elevated or cheap.
(Even though this is always a touchy subject in Trading - everything is relative!)
Markets in range rhyme with a general acceptance of prices, and buyers and sellers balance out.
GBP/JPY has been in a large range since September 2024 - let’s dive into how to determine a range on trading charts. Markets Generally Move In Two Primary Ways: Trending Or Rangebound.
How to Spot a Range - GBP/JPY Daily Timeframe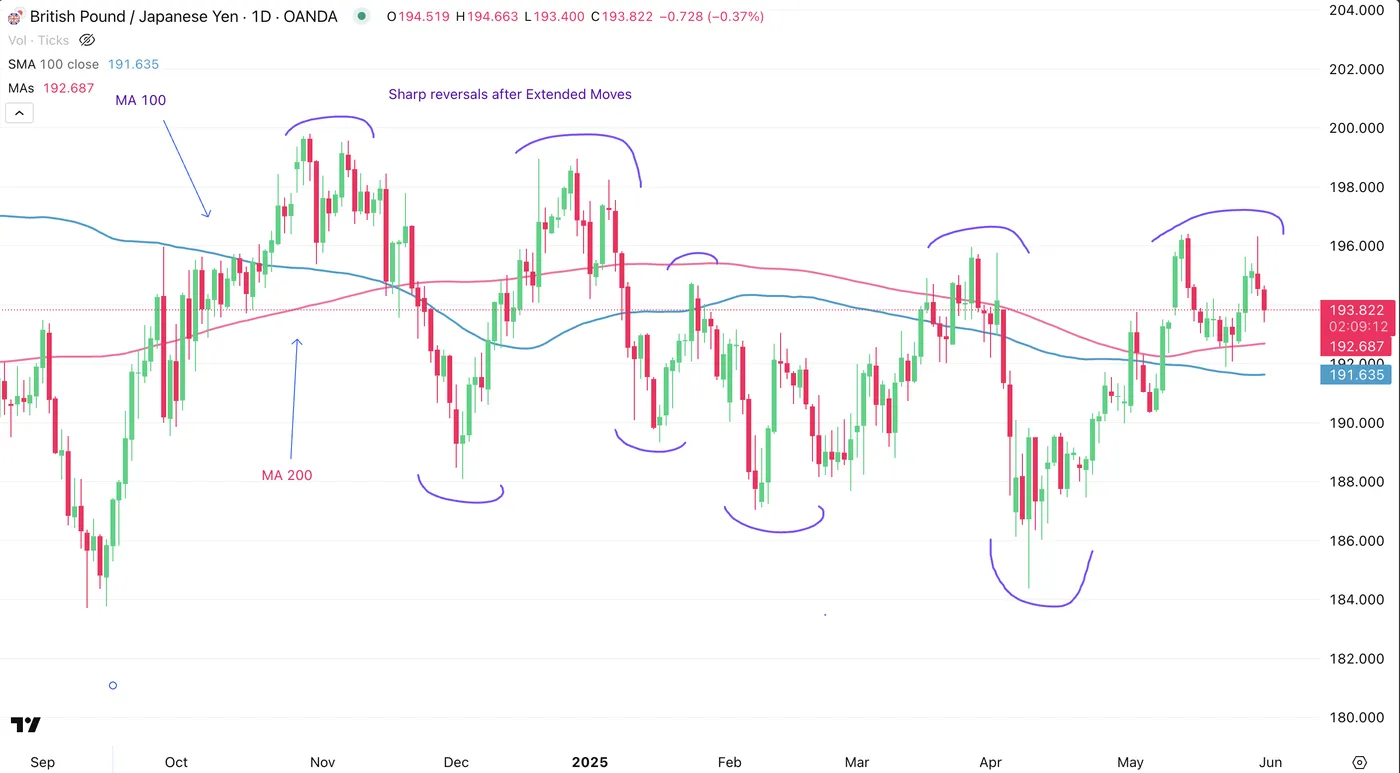
Source: TradingView
The first step is to spot those moves that go up, followed by sharp reversals. This will typically be done with two bounces on higher prices and two on lower prices.
The second step is to monitor your moving averages, preferably for a higher period (Above 100): you want to observe some flattening of the MA.
Moving averages are usually sloped in the trend’s direction in trending markets.
A third step is to add indicators such as the RSI or MACD. You will want to see how candles respond to overbought and oversold conditions:
- In trending markets, overbought doesn't always rhyme with reversals, usually consolidation before continuation of the trend.
- On the other hand, the same conditions will be met with sharp reversals in range-bound markets.
You will then want to draw levels where you will place your resistances and supports.
On this example, you can observe an extreme resistance (situated between 198.700 and 200.00) and an extreme support (184.500 to 186.00).
There is also a tighter range:
- The intermediate resistance - 195.50 to 196.50
- The intermediate support - 189.50 to 190.50
More prudent traders will want to wait for the extreme ranges while traders that want to generate more trades may use both.
The idea is to place a short when we enter the resistance zone and a long when we enter the support zone.
Drawing the Support and Resistance Levels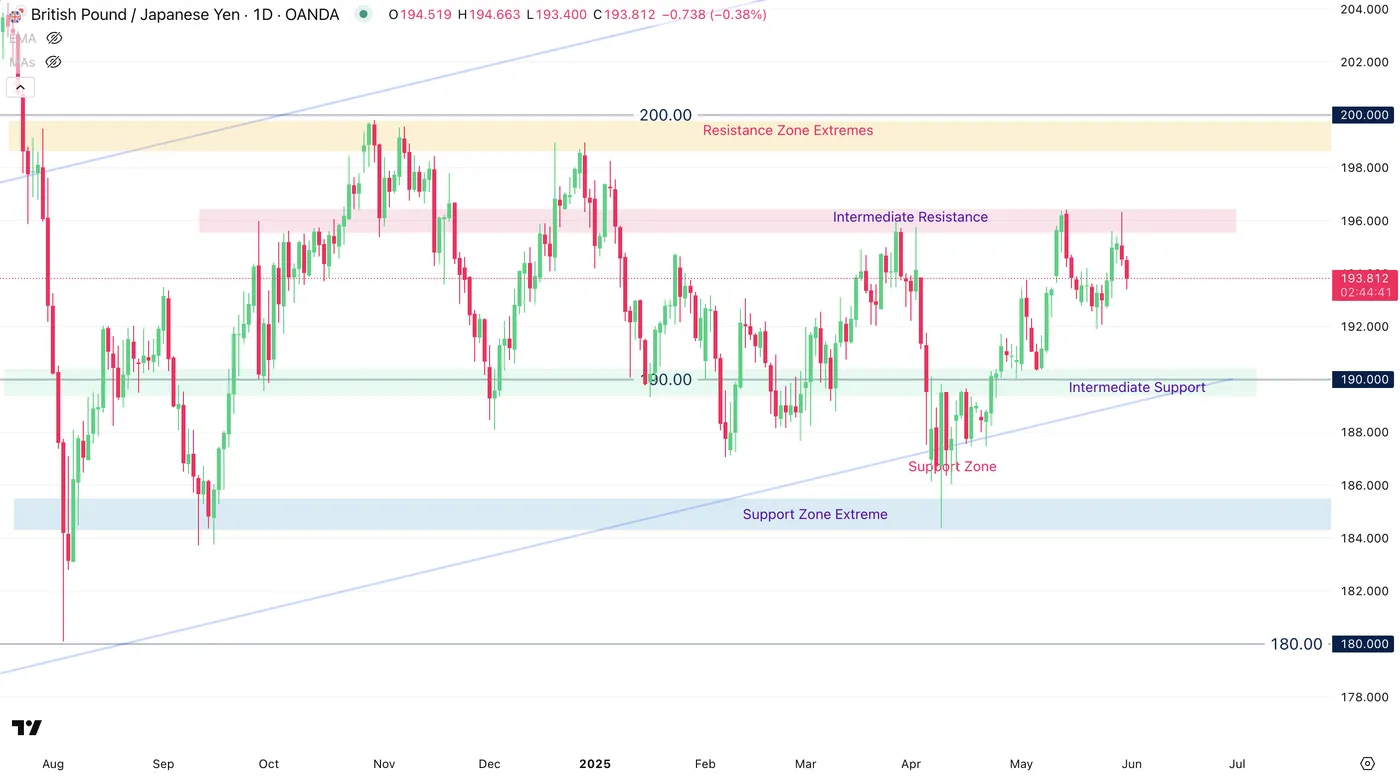
Source: TradingView
Ranges have different shapes and forms with the usual common idea: prices revert when they are at extremes.
You can either put line levels, though supports and resistances tend to move more in zones, which give a bit less chance for fake breakout signals.
This range in GBP/JPY is very volatile, as it is part of this currency pair's nature.
Placing the Trade
Source: TradingView
In this example, you may place your stop losses beyond the support and resistance zones.
You can set alarms on your charts to know when you are entering your zones of trading interest, then make your decision.
In terms of profit targets, it is up to you, although most guides point towards a risk-to-reward ratio above 2.
Once you have your stop pre-determined, you can use this rule to find where you will take profits.
You can also wait until the other extreme to close your trade.
Where to Take Precautions
In trading, there is always a possibility of things changing. This will usually happen around headlines or key economic data events.
Always stay in touch with the latest themes and trends.
Also, make sure to always know what economic data releases are expected, as they may change the dynamics of what is expensive or cheap.
Make sure to always watch your orders and take care of your risk.
Safe trades!
Trading in financial instruments and/or cryptocurrencies involves high risks including the risk of losing some, or all, of your investment amount, and may not be suitable for all investors. Prices of cryptocurrencies are extremely volatile and may be affected by external factors such as financial, regulatory or political events. Trading on margin increases the financial risks.
Before deciding to trade in financial instrument or cryptocurrencies you should be fully informed of the risks and costs associated with trading the financial markets, carefully consider your investment objectives, level of experience, and risk appetite, and seek professional advice where needed.
Fusion Media would like to remind you that the data contained in this website is not necessarily real-time nor accurate. The data and prices on the website are not necessarily provided by any market or exchange, but may be provided by market makers, and so prices may not be accurate and may differ from the actual price at any given market, meaning prices are indicative and not appropriate for trading purposes. Fusion Media and any provider of the data contained in this website will not accept liability for any loss or damage as a result of your trading, or your reliance on the information contained within this website.
It is prohibited to use, store, reproduce, display, modify, transmit or distribute the data contained in this website without the explicit prior written permission of Fusion Media and/or the data provider. All intellectual property rights are reserved by the providers and/or the exchange providing the data contained in this website.
Fusion Media may be compensated by the advertisers that appear on the website, based on your interaction with the advertisements or advertisers.