Trading Chances: FDAX, ES, USD/JPY, Oil
Markus Gabel | May 03, 2016 05:12AM ET
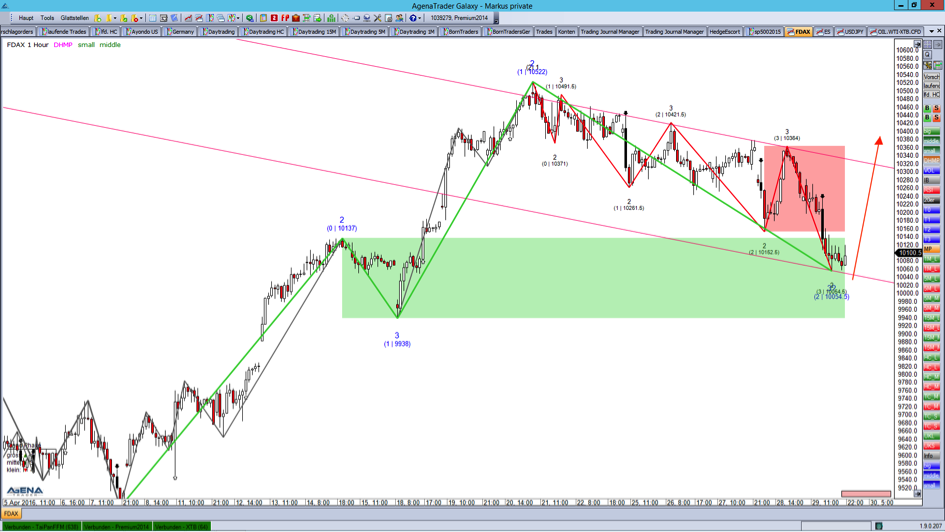
FDAX:
In this analysis we are looking at the hourly chart, and here we can see two trends. The first is the green uptrend, which has reached the current correction zone (green rectangle), and it seems as though the next movement could be starting very soon. In this case, we must set our stop below the green zone and our primary target at the last high at 10522 points.
The second trend is the red downtrend, which we must also take into consideration. This smaller trend is in a movement, and its correction zone runs between 10152 points and 10364 points on the upper side. I would like to point out that this trend has a corrective character only, and I would suggest that we concentrate on the medium uptrend.
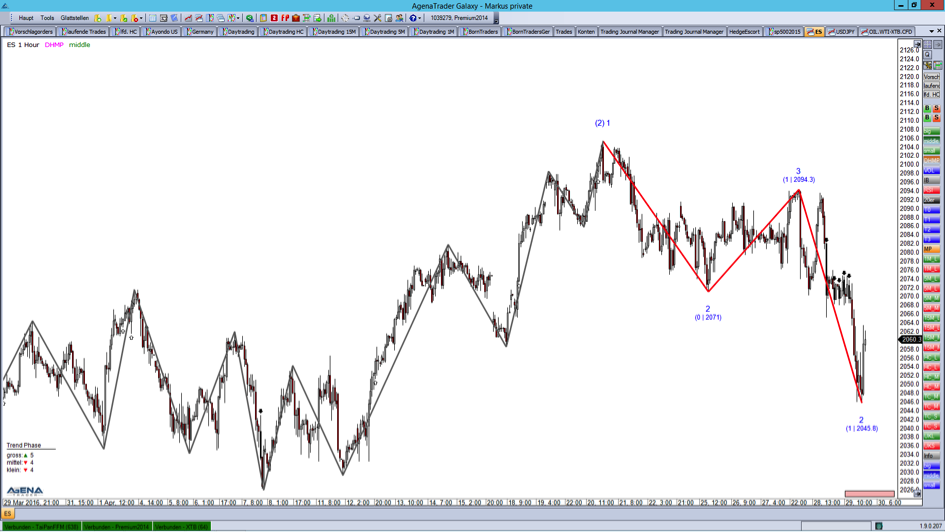
S&P 500 Futures:
This US index is in a completely different situation, because we see a very young downtrend. This trend is in a movement and has started a correction right now. The power of the buyers seems relatively strong, meaning that in this case we can expect the price to reach the lower edge of the correction zone at 2071 points very soon. If this happens, we can look for possible reversal signals and we will go short then.
USD/JPY:
The behavior of the BoJ surprised most of the traders around the world. All of them expected a further slackening of the monetary policy. But the BoJ did not act as expected, and changed nothing. The impact can be seen in the chart. The news came very close to 112 JPY, and the price dropped completely down and continued the current trade. Now we are deep into the movement, and with the knowledge that after a movement comes the next correction, we can expect that this will be the case.
WTI Crude Oil:
The light sweet oil is in a stable uptrend, where it is in a correction. The current correction zone runs from $45.17 down to $43.77, and the price is in the fifth arm of this trend. In my opinion, this is slowly becoming quite mature, and I am expecting more of a trend break than a trend continuation. This situation forces me to stay on the sideline.
I hope you will remain favorably disposed towards me and always remember: the journey is the reward! All the best.
Disclaimer: Exchange transactions are associated with significant risks. Those who trade on the financial and commodity markets must familiarize themselves with these risks. Possible analyses, techniques and methods presented here are not an invitation to trade on the financial and commodity markets. They serve only for illustration, further education, and information purposes, and do not constitute investment advice or personal recommendations in any way. They are intended only to facilitate the customer's investment decision, and do not replace the advice of an investor or specific investment advice. The customer trades completely at his or her own risk. Please refer to the current version of the Terms and Conditions.
Trading in financial instruments and/or cryptocurrencies involves high risks including the risk of losing some, or all, of your investment amount, and may not be suitable for all investors. Prices of cryptocurrencies are extremely volatile and may be affected by external factors such as financial, regulatory or political events. Trading on margin increases the financial risks.
Before deciding to trade in financial instrument or cryptocurrencies you should be fully informed of the risks and costs associated with trading the financial markets, carefully consider your investment objectives, level of experience, and risk appetite, and seek professional advice where needed.
Fusion Media would like to remind you that the data contained in this website is not necessarily real-time nor accurate. The data and prices on the website are not necessarily provided by any market or exchange, but may be provided by market makers, and so prices may not be accurate and may differ from the actual price at any given market, meaning prices are indicative and not appropriate for trading purposes. Fusion Media and any provider of the data contained in this website will not accept liability for any loss or damage as a result of your trading, or your reliance on the information contained within this website.
It is prohibited to use, store, reproduce, display, modify, transmit or distribute the data contained in this website without the explicit prior written permission of Fusion Media and/or the data provider. All intellectual property rights are reserved by the providers and/or the exchange providing the data contained in this website.
Fusion Media may be compensated by the advertisers that appear on the website, based on your interaction with the advertisements or advertisers.